Home » Human Rights

Category Archives: Human Rights

New Data Exposes Racial Bias in Fatal Police Encounters Nationwide

by Brian T. Lynch, MSW

Michael Brown was killed on the streets of Ferguson, Missouri, touching off community riots. Michael was African-American. The officer who shot him was white. Frustrations and local suspicions of racially biased policing, since then confirmed by a federal investigation, was simmering in that community for years. There have been other recent cases in the national news. There was the murder of Walter Scott of North Charleston, South Carolina, the sad shooting death of 12 year old Tamir E. Rice of Cleveland, Ohio and the choke hold death of Eric Garner in New York, to name just a few.

These shocking cases have focused national attention on what seems like a rash of questionable police killings involving minority citizens. Until now there has been no way of telling if the perception of police bias is due to  media bias, statistical flukes or real patterns of differential policing in minority neighborhoods. A big question hanging in the air:

Is the use of deadly force disproportionately used in Black or Latino communities?

I will answer that question below using newly gathered data. The question can’t be answered by standard government statistics. There is no mandatory or systematic reporting of police killings in America. With 17,000 law enforcement agencies acting mostly on their own, fatal encounters are seldom noticed beyond local news accounts, the bulk of these relying on local police statements. There is no public notification requirement when people are killed by police.

That’s why it is a big deal that several citizens have begun scanning the internet for local news accounts of police action fatalities and compiling a listing of them on their KilledByPolice.com Website. Shocking preliminary findings show that in just 23 months of record keeping 2,181 people were killed in police encounters. For some perspective, there were only 70 police killings in the past 90 years in Great Britain.

This analysis only looks at three demographic categories, White (non-Hispanic), Latino and Black. All other demographic categories are excluded because they are still too few in number for a meaningful analysis. The population totals and fatality data used here are only for these three study groups.  This is not to diminish the importance of other demographic group, especially in the fatality data, but that analysis will have to wait until more data is available. Also, local news accounts often do not report the race, ethnicity, or even the identity of person killed. This forces us to assume unreported demographic information, if known, would reflect the population as a whole rather than the fatality patterns observed below. This data includes all cases where a civilian is killed in a police action whether accidental, justified or unjustified.

Below are four comparative bar graphs for each of the US Census regions of the United States. It compares the distribution of the total White, Latino and Black population in the region with the distribution of people killed in police encounters within the region.

 If police action fatalities were random events then the demographic makeup of people killed should reflect the population. The four regional graphs above almost speak for themselves. In every region of the country Blacks comprise a significantly larger portion of those killed in police encounters than expected based on regional demographics.  You will notice that Latino populations are also over-represented among police action fatalities in the West.  I will discuss results in each region below and show some of the state data that may be significant in understanding these findings.

THE NORTHEAST

In the past 23 months there was a disproportionate number of police involved killings in the African-American community in the Northeast Region. There were 197 instances where people were killed in their encounters with police. This is the lowest number in any region, but this is also the region with the smallest population (for these three racial/ethnic categories). In 150 of these cases the ethnicity or race of the person killed was reported in the press. Blacks make up 13% of the population in the Northeast and 37% of police action fatalities. This is an unrepresentative finding. The numbers for Latino’s killed by police actions was slightly under represented. They represent 13% of the study population and 11% of those killed by police. Because the Northeast has fewer police action fatalities several states have fatality numbers too low for meaningful analysis. The three exceptions are New York, New Jersey and Pennsylvania.

New Jersey had more Black citizens killed by police than White citizens in the past 23 months. There were 31 police action fatalities, 25 of which where race or ethnicity was reported. Blacks make up 15% of New Jersey’s population but 52% of police action fatalities in this data. Twenty-five cases is really too confirm a finding, but the trend is startling.

In Pennsylvania and New York there were higher numbers of fatalities than in New Jersey and evidence that these were also disproportionately Black lives,

Pennsylvania had 52 police action fatalities, 14 where race/ethnicity was not reported and 38 others.  Blacks make up 11% of the three racial ethnic groups in this study and 34% of those killed in police actions. Latinos are 6% of this population and 8% of the fatalities.

New York had 56 incidents, 14 where race wasn’t reported and 42 others. Blacks comprise 17% of the study population and 43% of those killed in police actions. Latinos represent 19% of the study population and 9% of the casualties in police actions in the past 23 months.

The number of fatalities in Massachusetts were also disproportionately black, especially relative to the population, but the total number of police action fatalities was too small to be sure of the significance. Massachusetts had 26 police action fatalities of which race was not reported in 7 and 19 others where it was reported.

In the remaining states of Connecticut, Maine, New Hampshire, Rhode Island and Vermont the total number of people killed by police was 32 with 6 cases where race was not identified. Of the other 26 cases, 18 were White, 4 Latino and 4 Black.

THE MIDWEST

In the past 23 months there were 339 instances where people were killed in their encounters with police. In 255 of these cases the ethnicity or race of the person killed was reported. Blacks and Latinos each make up 13% of the study population but Black citizens made up 40% of all those killed in the Midwest during police encounters. Latinos were less likely to be killed in police actions. They were just 5% of the casualties. The states that had the most fatalities and largest disparities in the region were Ohio, Illinois and Missouri.

Ohio’s study population here is 13% Black yet 55% of those killed in police actions were Black. No Latinos were reported killed. There were a total of 61 cases where citizens were killed by police actions. Race was not reported in 10 of those cases.

Illinois had 63 citizens killed in police actions. No race or ethnicity was reported in 37% of those cases. Blacks are 15% of the study poplation but 55% of the police action fatalities. Latinos fared better, being 17% of population and 12% of the casualties.

In Missouri there were 49 citizens killed in police actions of which race was reported in 37 incidents. Blacks make up 12% of the study population and 49% of the police action fatalities.

In Wisconsin, Michigan and Indiana the rate of Black fatalities in police encounters were also higher than expected, but the number of individual cases were to few for individual analysis. The numbers for these three states were combined. The result yielded 87 cases, 61 of which where race was reported. Of those 61 cases 36 casualties were White, 2 Latino and 23 Black. Blacks make up 11% of the population in this combined group and 38% of the fatalities in police encounters.

In the remaining states of Iowa, Kansas, Minnesota, Nebraska, North Dakota and South Dakota the combined total of people killed in police actions was 46 with race not reported in 15 cases. No minorities were killed in North Dakota or South Dakota. Blacks and Latinos were 15% and 11% of the total casualties and Whites were 74% of the total.

THE SOUTH

The Southern Region is the most populated of the four regions. There are many states with over 30 incidents in 23 months, partly because of higher populations. There were 890 cases where people were killed in their encounters with police. In 652 of these cases the ethnicity or race of the person killed was reported. The Southern Region has the highest population, the highest number of police action fatalities and the highest percentage of African-Americans in the population. Blacks make up 20% of the population and Latinos another 17%. White, non-Hispanics are 63% of the total population. Black casualties of police actions made up 40% of the total cases in the prior 23 months. Latinos had 13% of the police action fatalities.

Alabama had 31 police action fatalities in 23 months where race was identified. Blacks represent 27% of the study population and 55% of the casualties. There were 8 additional cases where the race of the victim was not identified. No Latinos fatalities were identified.

In Florida there were 140 police action fatalities with a very significant 35 cases in which race or ethnicity was not identified. Blacks make up 17% of the study population and 38% of the casualties while Latinos are 23% of the population but only 13% of the casualties.

Georgia had 42 cases with 18 additional cases were the identity of the casualties were not provided. Blacks make up 32% of the state and 55% of the police action fatalities. Latinos make up 9% of the study population and just 2% of the casualties.

Louisiana had 27 police action fatalities where race the race of the casualties were know and 13 where this information wasn’t initially reported. Blacks are 33% of the population and 595 of the casualties. Latinos were evenly represented at 4% of both the study population and the casualties.

Maryland had 31 cases in 23 three months plus an additional 12 where race was not identified. Blacks make up 23% of the population but 68% of the police action fatalities. The highest ratio in the nation. Latinos represent 9% of the study population and 6% of the casualties.

North Carolina had 48 cases and 11 more where the racial or ethnic identity was not reported. Blacks make up 22% of the state and 55% of the police action fatalities. Latinos are 9% of the state and 4% of the casualties.

Oklahoma, with the smallest population in the South, had 45 police action fatalities where race was identified and another 12 where it wasn’t. Just 9% of the population is Black and they represented 38% of the fatalities. Latinos make up 10% of the population and 18% of the police action fatalities.

Tennessee had 31 incidents and 9 more cases where the racial identity was undisclosed. The state is 17% Black and Blacks made up 29% of the fatalities. Latinos are 5% of the population but 0% of the fatalities.

Texas has a large population and there were 153 police action fatalities where ethnicity or race of the casualties was identified. There were 51 other cases where this information was not reported in the local press. That is the highest number in this category. Blacks are 12% of the population and 25% of the police action fatalities. Latinos are 40% of the study population but only 37% of the casualties. The high number of cases where race or ethnicity was reported could substantially change these percentages.

West Virginia is note worth for having no minority police action fatalities. There were only 13 cases with 5 White casualties identified. The state is mostly White.

THE WEST

Turing attention to the West, there were 697 people killed in police encounters in the past 23 months. Of those, the race of those killed by police was reported in 491 cases. In this Region Blacks make up 6% of the study population and 14% of the police action fatalities. This is the lowest percentage of Black casualties in absolute terms but still over twice what it should be by chance alone. The Western region, on the other hand, has the highest percentage of Latinos of the four regions. It is also the only region where Latinos have a higher rate of police action fatalities than chance would allow. Latinos comprise 33% of the population and 38% of people killed in fatal police encounters.

Arizona had 94 police action fatalities in the past 23 months and the race of the person killed was released in 67 cases. Blacks comprise 5% of the population under study here and 9% of the casualties. Latino fatalities were more disproportional. They make up 32% of the population and 42% of the people killed in police encounters.

California had the most civilian fatalities in police encounters in the country and is also the most populated state. It had 351 police action fatalities of which the race of the casualties was reported in 251 cases. Blacks represent 7% of the population and 20% of the police action fatalities. Latinos are 45% of the population and 47% of the casualties.

Colorado had 43 police action fatalities of which 16 cases provided no information on race. Blacks are 4% of the population and 7% of the casualties in a police encounter. This is among the most representative of Black demographics for any state among high population states. On the other hand, Latinos comprise 22% of the population and 45% of the police action fatalities. This is the most disproportional rate for this group nationwide.

Nevada had 32 people killed in police encounters of which race was not reported in 12 (38%) of the cases. Blacks comprise 9% of the population and 15% of the casualties in fatal police encounters, while Latinos represent 30% of the study population here but 15% of the fatalities.

New Mexico had only 28 fatality incidents and just 3 cases where the race of the casualties was unreported. Blacks comprise 2% of the study population and 8% of those killed in police encounters. Latinos are 52% of the population and 48% of the civilian casualties.

Oregon had 29 fatal police encounters, 19 in which the race of the people killed was reported. Blacks are 2% of the study population and 5% of the casualties. Latinos make up 13% of the population and 11% of those killed in police encounters.

Utah had 25 police action fatalities, 23 in which race was identified. Blacks account for about 1% of the study population and 9% of the fatalities in police encounters. Latinos are 14% of the study population and 13% of the total, which is essentially a representative proportion.

In Washington State there were 58 cases were civilians were killed in police encounters. In 23 cases (43%) the race of the persons killed was not reported. Blacks comprise 4% of the study population and 11% of the fatalities. Latinos represent 13% of the population and 17% of the fatalities.

Wyoming had only 4 police action fatalities and all of the casualties were White.

Discussion

If my hypothesis is to disprove that African Americans are more likely to be the casualties in fatal encounters with law enforcement (the null hypothesis), then this journalistic analysis failed to prove it.

It might still be true that there is nothing to the perception that Black Americans are more likely to die in police encounters, but the evidence here strongly suggest the contrary, they are a disproportionate class of people killed in police encounters in virtually every region of the country. It can be said that this isn’t true in every state, but that is of little comfort to minority communities.

This review of this newly collected data supports the suspicions that minority communities may be subject to differential police tactics or over-policing.  The depth and breadth of these finds are disturbing. Blacks are simply more likely to be killed in police encounters in every area of the country and a majority of  state. Latinos are also more likely to be among the fatalities in the West. Fatalities in these police encounters are also overwhelmingly men. The gender basis of these findings have yet to be studied or even noticed, One might be tempted to think this higher rate of Black men being killed in police encounters is connected to so many young Black men being unemployed and on the streets, yet the average age of those killed by police is 36.9 years. This is almost exactly the average age in the U.S. population. This means there is no statistical bias due age which rules out a young black male theory.

Another factor some folks bring up is the high crime statistics in minority neighborhoods and a greater chance that minority folks act like criminals. First of all, there are very few crimes that carry a death sentence, which is was is administered by law enforcement where there are safer ways to apprehend a suspect. And crime statistics are mostly a sensitive measures of policing policies, tactics, training, law enforcement priorities and the culture or attitudes of those doing the policing. If you target any given group to enforce laws their crime statistics will climb. A secondary result of economic disparity and heavy handed policing is the contempt for the law that is often seen in poor and minority neighborhoods. The latter follows as a consequence from the former in nearly all cases.

As for minority folks acting like criminals, who is making that judgement and what is the evidence?

I have reviewed dozens of specific recent cases at this point and can say that some of these police action fatalities are completely justified but in most cases there aren’t enough detail to form  any judgments. There are also many cases where it seems law enforcement had other options to avoid the use of deadly force.  Very few cases involve independent investigations of the incident or judicial reviews. They rely on mostly local police accounts with no eyewitnesses or video cameras. The police are policing themselves.

To the best of this knowledge this is the first look at what is probably the most comprehensive collection of information about police action fatalities. This is more a journalist exercise than a scholarly study and this information badly needs a more scholarly treatment. Still, I believe the original question asked here can be tentatively answered in the affirmative:

The use of deadly force is disproportionately used in the Black community in every region of the country and in the Latino community in the West.

Advertisement

The Facts About Police Action Fatalities in America

by Brian T. Lynch, MSW

On April 4, 2015, Walter Scott, an African-American resident of South Carolina, was stopped for having a broken tail light. He was stopped by Officer Michael Slager, a White, North Charleston police officer. A few minutes later Scott was shot several times in the back while trying to flee. The incident was presented as a justifiable use of force by authorities until a videotape surfaced Slager calmly aiming his service weapon and firing into the back of Mr. Scott as he was running away. It was national news.

Stories of people killed by local police action rarely get national attention. Unless there is some dramatic twist or shocking video, the incidents are only reported in hyper-local community newspapers. The only sources for these reports are usually a police spokespersons and sometimes friends or grieving family members. When cases like the Scott shooting do capture regional or national attention they also raise significant, unanswered questions. Just how many citizens are killed in police actions in this country? Is this rare? Who is keeping track of the numbers? Does this sort of thing happen mostly in certain areas or departments? Is it just a few bad apples or are there larger patterns?

There are no national databases to track civilian deaths that result from police actions. The FBI does maintains a partial database of “justified police homicides,” but reporting by state and local authorities is voluntary. Only 750 of the more than 17,000 law enforcement agencies in this country submit their data. This limited reporting yields about 400 police homicides per year,

Almost two years ago a group of dedicated citizens began searching through local newspaper accounts of police involved civilian deaths throughout the country. They started a Website called KilledByPolice.net. They compile names of civilian casualties and added links to the initial news accounts. They also open a Facebook page on each person killed to post follow-up news accounts and to collect any local comments about these cases. Most of these fatalities are police homicides, justified or otherwise, but the data also includes murder/suicides by police officers, fatal DWI accident where the officers were intoxicated, police assisted suicides of mentally ill persons and other such categories. This effort turns out to be the most comprehensive data resource I’ve seen so far on police action fatalities. Based on this raw material I have begun my own analysis of the data.

Here is a brief summary of my initial findings to date.

Between May 1, 2013 and April 4th, 2015 there were 2,181 people killed by police officers in the United States. That works out to around 95 per month or 3 police action fatalities per day. There is clearly a gender bias in police action fatalities. Almost all are males, 2,044, with only 135 females killed in this 23 month period. In six other case the gender was undisclosed.

The full identity of 565 fatality victims were not disclosed to the media as of yet. The average age of the known fatality victims is 36.9 years, which is also the national median age of the population. This means that there is no age bias in police action fatality. Younger people are not more likely to be killed in a police action, for example.

Regarding race and ethnicity, Latino’s make up 18.7% of the general population and were 17% of the fatality victims during the past 23 months, suggesting their rate of police involved fatalities is proportional on a national scale. This may not be uniformly true in every locality.

Whites make up 77% of the population but only 48.1% of the victims. African-Americans make up just 13.2% of the general population but 30.5% of the total fatalities. This clearly suggests a racial bias in police action fatalities.

When the data was sorted by U.S. Census regions, 41.5% of all police action fatalities took place in the Southern states. Add California’s 730 incidents to the Southern total and the subsequent total account for 58.4% of all cases nationwide. In contrast, police action fatalities in the highly populated Northeast make up 9% of the total. (see pie chart) The large regional differences strongly suggest that these incidents are not the random acts of a few bad apples, as some suggest, but real differences in police training, policy and culture.


The states with the highest rate of police action fatalities, in descending order, are Alabama, Wisconsin, Washington State, Arizona, Oklahoma and New Mexico. Wyoming, Vermont and Idaho have the lowest rates. The states with the highest annual average of civilian fatalities are California (193), Texas (112), Florida (93), Arizona (50) and Illinois (33).

The data contained in the KilledByPolice Website is far more extensive since in contains reports of the police accounts and some follow-up articles, but this information is not yet in a form that allows for statistical analysis. It seems that most of the reports I reviewed so far involve police shootings, but this remains to be verified.

Defenders of law enforcement will say, with some justification, that the vast majority of police officers are honorable, law abiding and competent professionals who put their lives on the line to serve and protect the public. This is a true statement. As a whole the incidents of police action fatalities involves a tiny fraction of the overall mortality rate and it is sure to be a tiny fraction of all incidents of police engagement as well. This, however, is not a high standard to judge whether the current rate of fatal outcomes is significant.  To help put these numbers a national context, there were only 70 civilians killed by the police in Great Britain in the last 90 years.

The better standard to judge the significance of this problem is to ask how many of these civilian casualties could we have avoided. Even when a police shooting is ruled a justifiable homicide, for example, different tactics and better training might still have avoided a fatal confrontation. The justifiable use of deadly force is predicated on existing policies, procedures, tactical training, departmental culture and the careful vetting of law enforcement personnel, to list just a few factors. It is our obligation police action casualties and protect the life and safety of every citizen, including those who are subject of police actions. The problem is very real and it deserves public attention.

WATER, DETROIT AND THE ESSENTIALS OF LIFE

by Brian T. Lynch, MSW

Recent news accounts of the massive water shut-offs by the City of Detroit has drawn national and international attention to this essential utility that we sometimes take for granted. Over 17,000 residents have had their water shut off in that city for non-payment. About 12% of the 90,000 Detroit utility customers are delinquent by more than 60 days, and nearly half of the water customers are behind in payments (the latter fact according to an LA Times report). Since April of this year the city has targeted shut offs for 4,000 residents per week who are $150 or more in arrears.

 
Image Credit: http://www.waterpurifier.org


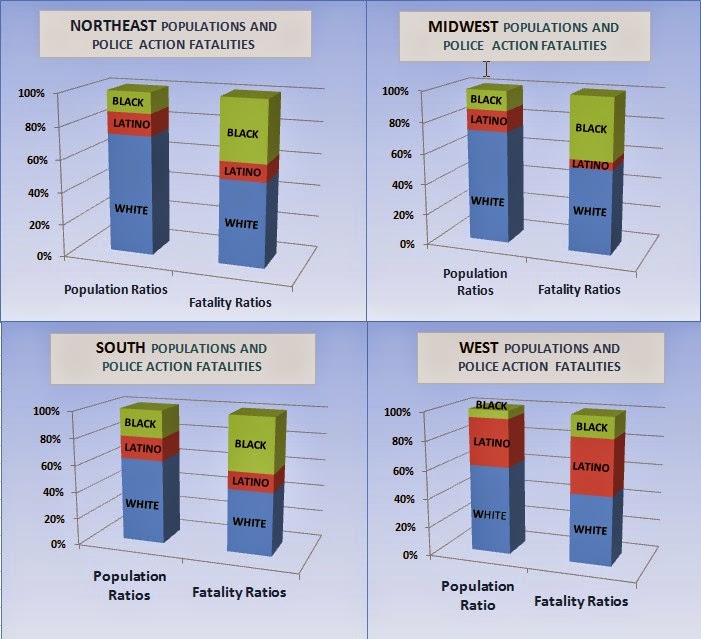
The delinquency rates aren’t new. Detroit is a shrinking city with lots of poor residents left behind. The city is bankrupt. The aggressive enforcement measures towards those behind in their bill is new. City management official claim that the water and sewer utility has been plagued by corruption, incompetence and inadequate maintenance for decades, and is seriously in debt. The utility’s bond rating is Baa with $5.4 billion in bond obligations. Moody’s Financial Ratio Analysis places the utilities debt ratio at around 90%.

Detroit is currently run by an appointed emergency manager selected by the Governor under a controversial new Michigan law. The emergency manager supersedes all elected authority in the city and has nearly absolute power. Pressure to shut off delinquent residential water customers comes under his authority. 

 
The move to turn off the water is controversial on several levels. Delinquent commercial and industrial customers are apparently not being targeted for cut offs. Residents claim their bills are excessive and State assistance isn’t forthcoming with any assistance. Community organizations have appealed to the United Nations. The U.N. recognizes access to water as a basic human right and holds that it is a violation of human rights to cut off people who legitimately cannot pay. The Detroit authorities claim that many residents intentionally don’t pay water bills, thus contributing to the crisis, a claim that citizen advocacy groups deny. There are rumors that the municipal owned utility might be sold to a private company, raising suspicions that this has been the plan all along. The water shut off policy has lead to angry street protests.

To understand Detroit’s situation it is helpful to step back first and look more broadly at water utilities here and abroad. 

Water Utility Rates are on the Rise

An article last year by Brett Walton at the “Circle of Blue” reported that: “Water prices in 30 major U.S. cities again grew at a pace faster than inflation, according to Circle of Blue’s annual survey of water rates for single-family residential customers. Water prices increased an average of 6.7 percent in these metropolitan areas, a slower rate than in recent years but well above the 2.1 percent increase in the U.S. Bureau of Labor Statistics’ Consumer Price Index for 2012. The median increase in water prices was 6.2 percent.” 

A 2000 survey by the U.S. Census Bureau found that, “The average annual cost of water and waste water for a household that pays directly for service is $476 per year, ranging from $334 in Nebraska to $721 in Hawaii.” That figure works out to about $40 per month while an EPA website says: “American household spends, on average, only $523 per year on water and waste water charges… ” That works out to a U.S. average of $43.58 per month for water and sewer. 

In a recent USA TODAY article entitled “Nation’s water costs rushing higher” it was reported that: 

“While most Americans worry about gas and heating oil prices, water rates have surged in the past dozen years, according to a USA TODAY study of 100 municipalities. Prices at least doubled in more than a quarter of the locations and even tripled in a few.[snip] Monthly costs topped $50 for consumers in Atlanta, Seattle and San Diego who used 1,000 cubic feet of water, a typical residential consumption level in many areas.

There is also a water and sewer industry report prepared in 2012/2013 by Black and Veatch, a private firm. This report says the cost of water in Seattle, for example, was $8.19 per 1.000 gallons, not including the sewer charges. The combined monthly bill for sewer and water in Seattle was $177.93 per month for residential customers using 7,500 gallons, according to this report. 

Meanwhile in Detroit, according to the Black and Veatch report, the monthly water and combined sewer and water rates for residential customers using 7500 gallons per month was $24.12 and 70.89 respectively. So which figures are correct?

It turns out that water and sewer utility prices are deceptively difficult to understand or to compare from city to city. There are different units of measurement, different seasonal schedules, peak and off-peak metering and different rate structures. Also, in cities especially, water and sewer rates are separately billed but inseparable because water use is the measure of sewer use in most cases. Billing is combined. Sewer rates are generally higher, often double the water rates. Comparing water pricing without including sewer pricing can be very misleading. Finally, to get a full picture of a municipal utility overall, it is important to compare the rates for commercial water/sewer uses and the wholesale rates the utility charges industries.

An Apples to Apples Comparison
The table below directly compares the published water and sewer rates for Detroit and Seattle (converted to dollars/1,000 gallons). Seattle was selected for comparison because it was one of the cities mention in the USA Today article as having the highest rates. The data is from both city websites. 

At first look it appears that Seattle water and sewer prices are significantly higher than in Detroit. The average Seattle resident uses 3,740 gallons of water per month for a combined water/sewer bill of $112/mo. compared with $62/mo. in Detroit. But when you take a closer look you see that Seattle has a two tier residential rate. The published rate is for residents who can afford it while those families making less than 70% of the city’s median income receive a 50% discount. The discount only applies to low wage families who aren’t eligible for HUD (Section 8) federal assistance, and the municipal utility actively helps low wage customers apply for federal aid if eligible. They also have programs to help families conserve water and they have very flexible payment plans for any residents who fall behind according to the spokesperson with whom I talked. Shutting off water to a customer would not be considered for residents who owe less than around $1,000. 

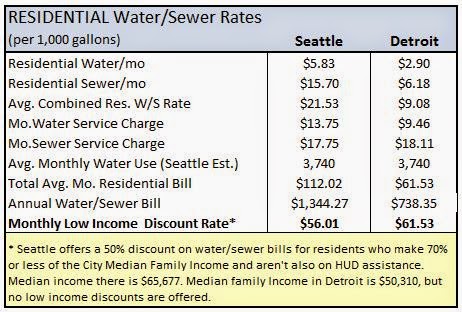
Detroit, a city with a median family income 25% lower than Seattle, has flat rates. It offers no low income discounts. As a result, the average low income water/sewer bill in Detroit is higher than in Seattle. 

To complete the look at water and sewer utilities in these two cities it is important to compare rates for retail commercial and wholesale water customers as well. The information on the websites is a little more difficult to extract in this area. The graph below is my best attempt. 


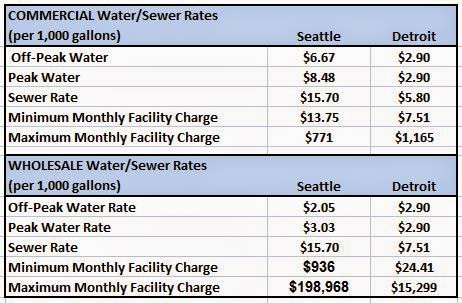
What jumps out here is the different rate structures in these two cities. Commercial rates in Seattle are somewhat higher than in Detroit, the monthly minimum and maximum wholesale facility charges are significantly higher. Seattle also has a peek commercial water rate that is higher than off-peak to encourage conservation. Meanwhile the difference in the maximum and minimum facility charges in the two cities is 13 times and 38 times higher in Seattle. This suggests that there may be some latitude for Detroit to raise commercial and wholesale water/sewer utility rates to help offset the current financial short fall. Additionally, the Detroit utility could also consider raising residential rates for customers who can afford the increase and discounting rates for low wage earners, as Seattle does.

In the meantime, Detroit should look at the creative collection alternative already practiced in other states and try to find effective alternatives to shutting off water to so many of the residents they are honor bound serve. Access to water is an essential human right and cutting off resident from water should be a last resort. Just reviewing the rate structure suggests possibilities that may not have been considered yet.

A Global Perspective
How do U.S. water rate compare with the cost of water in other cities around the world?

The Organization for Economic Co-operation and Development ( OECD ) conducted two surveys of residential water tariffs in 1999 and in 2007-08, using a reference consumption of 15 cubic meters per household per month. The 2007-08 survey covered more than 150 cities in all 30 OECD member countries. The survey does not claim to be representative. The OECD survey was complemented by a survey of the industry information service Global Water Intelligence (GWI) conducted in 2007-2008 in parallel with the second OECD survey. The 2008 GWI survey covered 184 utilities in OECD countries and 94 utilities in non-OECD countries. GWI has repeated its survey every year from 2009 to 2012, increasing the number of utilities surveyed to 310 in 2012.

When you convert the OECE findings to US gallons the results indicate that the average water rate in the 310 global cities surveyed is $7.50/1,000 gallons. The range of water rates vary greatly from $0.11 per 1,000 gal. in Saudi Arabia, to $34.86 per 1,000 gal. in Denmark. Then there are also countries, such as Ireland, where water is delivered to households free of charge.

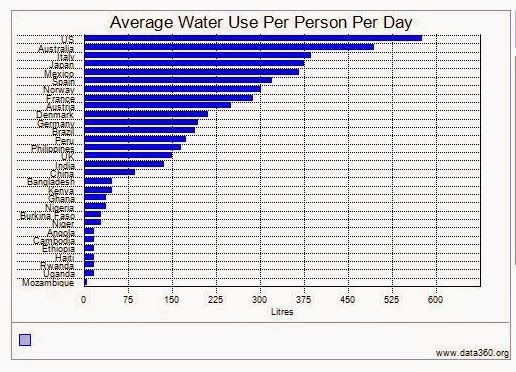
The benchmark for monthly water use in the OECD survey was 15 cubic meters per month, or 3,963 gallons per month, compared with 7,481 gallons per month in the United States. As the graph below shows, U.S. households use more water than do households in most other countries. In the examples above, the difference represents an 88% higher rate of water use in the U.S.

To complete the comparison it is important to acknowledge that higher volumes of water used per household in the US lowers the cost per gallon. In the USA TODAY article, greater conservation of water by customers was named as one of the reasons for higher water rates. When you factor in the average water use in the US with the benchmark estimate of average monthly use in the OECD study, residents in Atlanta, Seattle and San Diego are paying approximate $50 per month for water while residents in foreign cities are paying about $30 per month. 

If U.S. water consumption dropped to the lower global levels, residents in the cities mentioned above would pay about $27 dollars per month. However, lowering water use that much in the U.S. would significantly raise the cost per gallon. There are so many variables and assumptions in all of the underlying data that this is a rough guess. 

Keep in mind also that the cost of water for the data cited here is for cities, yet it isn’t clear if the figures given include sewer costs. The quality of sewer systems and their associated costs vary greatly, both nationally and across the globe. The best that we can gather from this very rough comparison, then, is the impression that current water rates in the U.S. are somewhat comparable with average global rates. 

Water is an essential part of our daily life and a human right. It is a finite resource that is growing in scarcity. Social and environment forces are combining to raise water prices everywhere. The trend in rising prices is likely to accelerate as U.S. water conservation become more essential to meet our basic water needs, and this article doesn’t even touch on agricultural where most of our water is used. With scarcity comes increased commercial opportunities and there will be growing pressure to privatize municipal water utilities for profit. Balancing commercial interests with human needs and human rights is a conversation we need to have. Increasing public awareness is critically important for our future and the media will need to do more and better reporting to inform the public.

Kids in Cages – Refugee Crisis at Our Border

by Brian T. Lynch, MSW

It is It was Father’s Day and I was still haunted by story I hear about earlier this week. Over 70,000 children a year are coming across the US border from places like Guatemala, Honduras, El Salvador and Mexico, many of whom are unaccompanied minors. The United States is forced to house these children in temporary detention facilities under very difficult conditions. The situation is desperate as federal agencies and facilities designed to house adults races to accommodate the special needs of young children.

On All In with Chris Hayes, José Diaz Balart reported about the humanitarian crisis at the US Mexican border. Unaccompanied minors are crossing the border in record numbers, sometimes as many as 300 a day. Some of these children are as young as 18 months old. But also, there are couples trying to cross the border with their children who are being met by members of Mexico’s drug cartel that take one of the parents hostages for ransom, allowing the other parent and children to cross into the States.

Balart also reported on the conditions that are creating these developments. One Guatemalan mother told him gang violence in her country is so bad that when their daughters reach puberty, gang members will come in and either rape them, kill them, or take them as their property. These parents feel they have no option but to send their children across the border to safety. When US officials try to interview young children to learn who their parents are it is not unusual for 4 and 5 years to not know their parents names or the name of the towns in which they lived. In some cases, trying to reunite children with their families is impossible.

While we flounder around once again in Iraq and other foreign lands with oil resources of interest, we are ignoring the deteriorating humanitarian situations in our own hemisphere. The immigration issues we face are usually couched in protectionist language when the root of the problem is really about promoting growth and stability in foreign countries much closer to home.

We need to direct more resources and attention on foreign aid and international diplomacy among our Latin American neighbors. The social and economic conditions in these countries have reach a crisis proportions. Our immigration problem is a massive refugee problem that our politics and the media isn’t addressing. The answers to real immigration reform fall well beyond the scope of our current political dialogue.

NSA, The More We Know The More We Fear – For a Reason

The recent opinion piece (below) by Amy Zegart and Marshall Erwin of the conservative Hoover Institution suggests the NSA spy agency’s real problems are caused by our not knowing how well they protect us from terrorists.  They think the NSA should focus on this rather than correcting our  “misperceptions” about how they use our email and telephone data. They wrote that, “…there is no evidence the NSA is engaged in any illegal domestic snooping,” even though such evidence requires transparency and everything the NSA does is secret.

Setting aside recent proof that NSA employees do sometimes breach security protocols, we know the NSA maintains a database of electronic “envelope”  information from all our calls and emails. From this information they create their meta-data analysis that reveals how closely each of us is linked to anyone else. But the NSA also has yet to deny that they are storing the content of our emails, and possibly our phone calls, in huge data storage facilities such as the recently built Utah Data Center, officially called the Intelligence Community Comprehensive National Cybersecurity Initiative Data Center. The NSA may not be previewing all this content data, but saved records can be accessed and reviewed in the future if they choose to look. By any stretch of meaning, saving private electronic content by government, even if it is never opened, is still an unreasonable government seizure prohibited by the Fourth Amendment.

So, is it reasonable for government to seize all our private emails or phone conversations providing they don’t peek? If so, then what’s to stop state or local law enforcement from doing the same. And what’s to stop the NSA from making secret allegations, obtaining secret FISA court access to stored communications or even altering those files to persecute citizens perceived as a threat? Our founding fathers would not have consented to this and neither should we. Protecting us from terrorist threats doesn’t justify suspending Fourth Amendment rights protecting us from tyranny at home.

Shedding light on NSA's snooping

The NSA’s image problem

To know the spy agency is not necessarily to love it.

http://www.latimes.com/opinion/commentary/la-oe-zegart-nsa-effectiveness-20131101,0,1883353.story#axzz2jMeD4paf

By Amy Zegart and Marshall Erwin

November 1, 2013

In the wake of Edward Snowden‘s ongoing revelations about U.S. surveillance programs, the National Security Agency is facing the worst crisis in its 60-year history. Today, too many Americans mistakenly believe the NSA is listening to their phone calls and reading their emails. But misperception is only part of the agency’s problem. In an Oct. 5-7 YouGov national poll we commissioned, we also found the more that Americans understand the NSA’s activities, the less they support the agency. [snip]

Our poll results found the part about the public’s ignorance was true. But we did not find that ignorance bred greater distrust of the agency. [snip]

For example, Americans who accurately understood the NSA’s telephone metadata program were no more favorable toward the agency than those who mistakenly thought metadata involved snooping on the content of calls. [snip]

NSA Director Gen. Keith Alexander [has said]: “And so what’s hyped up in a lot of the reporting is that we’re listening to your phone calls. We’re reading your emails. That’s just not true.” [snip]

The NSA needs to win this debate on the merits. What we need to know is whether the agency’s telephone and Internet surveillance programs are wise and effective.

Though legal scholars will continue to debate endlessly just what “relevance” or “targeting” means, the message from these disclosures for the rest of us is this: There is no evidence that the NSA is engaged in any illegal domestic snooping operations.

For national security, the more important question now is whether these programs are good counter-terrorism policy. We have lost sight of that.

[read more at http://www.latimes.com/opinion/commentary/la-oe-zegart-nsa-effectiveness-20131101,0,1883353.story#axzz2jMeD4paf ]

The Death Penalty in Alabama: Judge Override

Equal Justice initiative
122 Commerce Street
MontgomeryAlabama 36104
334.269.1803
July 2011

 EXECUTIVE SUMMARY AND MAJOR FINDINGS

No capital sentencing procedure in the united States has come under more criticism as unreliable, unpredictable, and arbitrary than the unique Alabama practice of  permitting elected trial judges to override jury verdicts of life and impose death sentences.

  • Of the 34 states with the death penalty, Alabama is the only jurisdiction where judges routinely override jury verdicts of life to impose capital punishment.
  • Since 1976, Alabama judges have overridden jury verdicts 107 times. Although judges have authority to override life or death verdicts, in 92% of overrides elected judges have overruled jury verdicts of life to impose the death penalty.
  • Twenty-one percent of the 199 people currently on Alabama’s death row were sentenced to death through judicial override.
  • Judge override is the primary reason why Alabama has the highest per capita death sentencing rate and execution rate in the country. Last year, with a state population of 4.5 million people, Alabama imposed more new death sentences than Texas, with a population of 24 million.
  • Override is legal in only three states: Alabama, Delaware, and Florida. However, Florida and Delaware have strict standards for override. No one in Delaware is on death row as a result of an override and no death sentences have been imposed by override in Florida since 1999. In Delaware and Florida, override often is used to overrule jury death verdicts and impose life – which rarely happens in Alabama.
  • Alabama’s trial and appellate court judges are elected. Because judicial candidates frequently campaign on their support and enthusiasm for capital punishment, political pressure injects unfairness and arbitrariness into override decisions.
  • Override rates fluctuate wildly from year to year. The proportion of death sentences imposed by override often is elevated in election years. In 2008, 30% of new death sentences were imposed by judge override, compared to 7% in 1997, a non-election year. In some years, half of all death sentences imposed in Alabama have been the result of override.
  • There is evidence that elected judges override jury life verdicts in cases involving white victims much more frequently than in cases involving victims who are black. Seventy-five percent of all death sentences imposed by override involve white victims, even though less than 35% of all homicide victims in Alabama are white.
  • Some sentencing orders in cases where judges have overridden jury verdicts make reference to the race of the offender and reveal illegal bias and race-consciousness. in one case, the judge explained that he previously had sentenced three black defendants to death so he decided to override the jury’s life verdict for a white defendant to balance out his sentencing record.
  • Some judges in Montgomery and Mobile Counties persistently reject jury life verdicts to impose death. Two Mobile County judges, Braxton Kitrell and Ferrill McRae, have overruled 11 life verdicts to impose death. Former Montgomery County Judge Randall Homas overrode five jury life verdicts to impose the death penalty.
  • There are considerably fewer obstacles to obtaining a jury verdict of death in Alabama because, unlike in most states with the death penalty, prosecutors in Alabama are not required to obtain a unanimous jury verdict; they can obtain a death verdict with only ten juror votes for death. Capital juries in Alabama already are very heavily skewed in favor of the death penalty because potential jurors who oppose capital punishment are excluded from jury service.

HOUSTON, TAKE DOWN THIS THREATENING MESSAGE

An Orwellian chill ran through my veins as I sat waiting for my connection at Houston’s George Bush Intercontinental Airport.  It was the early hours of the morning and the Eastern sky was just starting to brighten.  Travelers milled about the vast terminal or sat in various stages of slumber at the terminal gates as a female voice echoed over the public address system.  It was that familiar security announcement about keeping track of your luggage and such.  No one seemed to notice when this particular message went on to say:

 “You are also reminded that any inappropriate comments or jokes concerning security  may result in your arrest.  We appreciate your cooperation while these measures are in effect.”

Arrest?  “While these measures are in effect”?

I looked around.  No one else seemed to notice they had just been threatened with arrest for cracking jokes or making comments that some security agent might not like.  I suddenly felt less free and less safe from the mercurial powers of the state.

Once we discovered that jetliners can become weapons, tightened security was inevitable, but infringing on our First Amendment rights was not part of the bargain.  It’s one thing to take off your shoes and empty your pockets,  it’s quite another to face arrest for “inappropriate” speech.

Free speech has boundaries, of course.  Everyone knows you can’t yell “fire” in a crowed theater or threaten someone with bodily harm, but when was the last time you were reminded about this in a public announcement at your local cinema?  Houston’s airport message was obviously not referring to the normal boundaries of free speech.

From where does this authority to arrest come and how broadly is it being interpreted?  What law enforcement authority approved this chilling message?  And why is this additional “measure” in effect in Houston but not in most other airports, such as in Newark’s Liberty or New York’s Kennedy Airport?

It seems unlikely that the federal Transportation Security Administration (TSA) would be behind this announcement.  The TSA has very limited law enforcement authority.  Unless you are committing a felony under US law in their presence, TSA agents have no routine power to arrest you (49 USC 44903(d)(2)).  And as far as I know,  joking about airport security isn’t a felony.  The authority of the TSA extends mostly to allowing passengers to fly or not fly.  They can detain you for the purpose of screening or inspecting your personal property, but can’t arrest you if they find, say, a pen knife in your bags.  If you refuse to be searched, they can deny you access to the plane.   Having said that, the practical reach of the TSA is still an open question and there are examples of apparent abuses of their power.  (For an interesting post on TSA authority see: http://www.papersplease.org/wp/2009/04/20/tsa-claims-new-powers-of-detention-search-and-interrogation/).

Most large airports are owned by state or local governments in the US.  They operate under state or local authorities, sometimes through an airport authority administration or private management company.  Airport security, other than passenger screening, is usually provided by state or local law enforcement agencies.

The George Bush Intercontinental Airport is owned and operated by the City of Huston.  It is likely that the Houston Police Department is in charge of airport security.  In fact, on the Houston Police Website, M. A. Eisenman is the Assistant Police Chief in charge of the Homeland Security Command and C. W. Driskel is Captain of the Airport Division.  If there is a law or temporary measure to limit free speech, the city of Houston and not the TSA would be responsible.

There is internet evidence that this same message has been playing in Houston since at least 2007.  In the years since this security message first played, the Iraq war ended, Osama Bin Laden was killed by our special forces, his terrorist network has been decimated, the war in Afghanistan has nearly drawn to a close and there has been no  significant attacks in the United States.  The “war on terror” is settling into a more or less routine program of security vigilance and covert actions.  The flying public accepts today’s airport security arrangements.  If there was ever a need to threaten citizens with arrest for inappropriate speech, that heightened need has surely passed.  It is time for the City of Huston to stop threatening citizens with arrest for making bad jokes and restore respect for our First Amendment liberties.  Houston, take down this threatening message!