Home » Posts tagged 'Employment' (Page 2)
Tag Archives: Employment
Taxpayer Subsidized Downsizing in America
The business of quick and dirty layoffs has become a familiar feature in our culture. One recent example involved a journalist who worked at a large news organization. He was new to the company so he gratefully accepted the friendship of a well respected senior reporter. One Friday morning his mentor emailed him about a story idea and ended it by writing, “I’ll see you at the 10 AM meeting.” This prompted the following email exchange:
“What meeting? I didn’t get the email.”
“I’ll forward it do you.”
Then a short time later: “Forget the email. This meeting isn’t for you. Don’t come to this meeting!”
This is how the newsroom learned that day of the layoffs. Many senior journalists were let go along with a few younger reporters to avoid the appearance of age discrimination. As these “redundant” employees filed from the meeting they were handed garbage bags for their personal effects and accompanied to their desks by hired chaperones. It was all over in an hour.
Coolly calculated business decisions and pitiless firings toss employees off company books and onto government unemployment rolls somewhere in this country nearly every week. No notices, no outplacement services, no severance pay and no extended benefits are required. In many cases there is no effort to treat employees with the dignity or respect they deserve.
Apart from union contracts or employment agreements, American companies have no legal obligations to citizens being fired. They need not assume any responsibility for the impact it has on an employee, their family or their community. The only business costs of any significance are the premiums companies pay for government unemployment insurance. This easy, low cost ability to fire workers is called “workforce efficiency” and the U.S. is among the most efficient in the world. We ranks 12th out of 144 nations according to the study on global business competitiveness .
In most other advanced nations there are laws requiring companies to provide loyal employees with advanced layoff notices, severance pay and other benefits. These structural costs for downsizing may make businesses a little less competitive, but it brings significant benefits. It helps maintain a stable workforce and postpones government funded assistance to severed employees while they look for jobs. Requiring larger companies to provide mandatory severance benefits helps the nations absorb minor bumps in the economy without adding to problems by throwing people out of work at the first sigh of trouble. It also happens to be a humane way for citizens to treat one another.
Here in this country we treat our labor force as if it were a commodity to be bought and discarded at will. In the end, big business lets taxpayers foot most of the costs for unemployment benefits and supplemental welfare services for people out of work. At the same time the pro-business lobby pushes Congress for business tax breaks and budget cuts in the programs that help the workers they leave behind. Isn’t it time we stopped bowing to the pro-business lobby and stand up for the American worker?
Government Jobs Not Rebounding As In Past Recessions
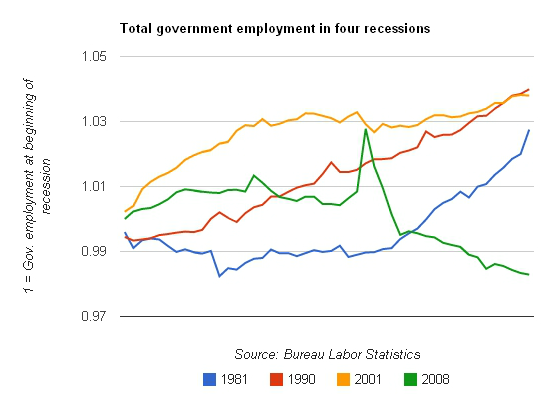

Public-sector austerity in one graph
On Friday, I ran some numbers on public-sector employment: Since Obama was elected, the public sector has lost about 600,000 jobs. If you put those jobs back, the unemployment rate would be 7.8 percent. [SNIP]
Today, Ben Polak, chairman of the economics department at Yale University, and Peter K. Schott, professor of economics at the Yale School of Management, widen the lens, with similar results: There is something historically different about this recession and its aftermath: in the past, local government employment has been almost recession-proof. This time it’s not. [SNIP] Go to like to read the rest of Ezra Klein’s article. Thank you.
Half of All Full-time Employees Earn Less Than $19/hr.
Bureau of Labor Statistics
For release 10:00 a.m. (EDT) Thursday, October 18, 2012 USDL-12-2072
Technical information: (202) 691-6378 • cpsinfo@bls.gov • www.bls.gov/cps
Media contact: (202) 691-5902 • PressOffice@bls.gov
USUAL WEEKLY EARNINGS OF WAGE AND SALARY WORKERS THIRD QUARTER 2012
Median weekly earnings of the nation’s 103.6 million full-time wage and salary workers were $758 in the third quarter of 2012 (not seasonally adjusted), the U.S. Bureau of Labor Statistics reported today.
This was 0.7 percent higher than a year earlier, compared with a gain of 1.7 percent in the Consumer Price Index for All Urban Consumers (CPI-U) over the same period.
Data on usual weekly earnings are collected as part of the Current Population Survey, a nationwide sample survey of households in which respondents are asked, among other things, how much each wage and salary worker usually earns. (See the Technical Note.) Data shown in this release are not seasonally adjusted unless otherwise specified. Highlights from the third-quarter data are:
- Seasonally adjusted median weekly earnings were $765 in the third quarter of 2012, little changed from the previous quarter ($773). (See table 1.)
- On a not seasonally adjusted basis, median weekly earnings were $758 in the third quarter of 2012. Women who usually worked full time had median weekly earnings of $685, or 82.7 percent of the $828 median for men. (See table 2.)
- The female-to-male earnings ratio varied by race and ethnicity. White women earned 83.4 percent as much as their male counterparts, compared with black (93.2 percent), Hispanic (87.5 percent), and Asian women (73.1 percent). (See table 2.)
- Among the major race and ethnicity groups, median weekly earnings for black men working at full-time jobs were $633 per week, or 74.1 percent of the median for white men ($854). The difference was less among women, as black women’s median earnings ($590) were 82.9 percent of those for white women ($712). Overall, median earnings of Hispanics who worked full time ($556) were lower than those of blacks ($606), whites ($780), and Asians ($915). (See table 2.)
- Usual weekly earnings of full-time workers varied by age. Among men, those age 45 to 54 and 55 to 64 had the highest median weekly earnings, $976 and $980, respectively. Usual weekly earnings were highest for women age 35 to 64; weekly earnings were $740 for women age 35 to 44, $754 for women age 45 to 54, and $766 for women age 55 to 64. Workers age 16 to 24 had the lowest median weekly earnings, at $437. (See table 3.)
- Among the major occupational groups, persons employed full time in management, professional, and related occupations had the highest median weekly earnings—$1,300 for men and $948 for women. Men and women employed in service jobs earned the least, $530 and $440, respectively. (See table 4.)
- By educational attainment, full-time workers age 25 and over without a high school diploma had median weekly earnings of $464, compared with $648 for high school graduates (no college) and $1,170 for those holding at least a bachelor’s degree. Among college graduates with advanced degrees (professional or master’s degree and above), the highest earning 10 percent of male workers made $3,448 or more per week, compared with $2,311 or more for their female counterparts. (See table 5.)
Revision of Seasonally Adjusted Usual Weekly Earnings Data The Usual Weekly Earnings news release for the fourth quarter of 2012 will incorporate annual revisions to seasonally adjusted data for the number of full-time wage and salary workers and median weekly earnings in current dollars. (See table 1.) Estimates for constant (1982-84) dollar median weekly earnings also will be affected by revisions to the current dollar series. Seasonally adjusted estimates back to the first quarter of 2008 will be subject to revision.
Go to Tables: http://www.bls.gov/news.release/pdf/wkyeng.pdf
Thank Unions
THANK UNIONS
If you enjoy a weekend off now and then, you can thank labor unions.
If you had a holiday off this year, you can thank labor unions.
If you take a week or two off to relax in the summer, you can thank labor unions.
If you can afford a place to live and can put food on the table, you can thank labor unions.
If you have a pension at your job, you can thank labor unions.
If you are not fired when you are out sick, you can thank labor unions.
If you get paid sick time, you can thank labor unions.
If you are home for supper and can tuck your children in bed, you can thank labor unions.
If your employer tries to keep you safe on the job, you can thank labor unions.
If you aren’t fired if you get hurt on the job, you can thank labor unions.
If you get paid time off after being hurt on the job, you can thank labor unions.
If you aren’t fired when your boss’ nephew needs a job, you can thank labor unions.
If you get extra pay or time off for working extra hours, you can thank labor unions.
Most of us don’t have to be in a union today to enjoy these benefits.
We just have to live in the beautiful parts of American life that labor unions built.
Stop Spanking Unions!
Start Thanking Unions!
Take the Labor Quiz
How much to you know about economic changes in America’s labor force over the last 30 years? Apart from the occasional new article on Labor Day, few of us give much thought to the extraordinary sacrifices that were required of prior generations in order to bring us the level of comfort and dignity so many of us enjoy today. But the blessing our grand parents and great grand parents fought so hard to bring us are beginning to disappear. America, once the leader in raising up the middle class, has fallen behind many other advanced nations.
An article entitled “The Speedup” in the July-August, 2011 edition of Mother Jones, written by Monika Bauerlein and Clara Jeffery, takes a look at this issue. I created a pop quiz based on some of the facts in the article. Take the quiz to see how well you are doing as an American worker. There are only 7 questions, so it won’t take long. The answers are below. If you score very high you should take the afternoon off, maybe.
1. What does the USA have in common with Papua New Guinea, Sierra Leone, Liberia, Samoa and Swaziland?
a. We all celebrate the Fourth of July
b. Like us, baseball is their national pass-time.
c. We are the only six nations on earth that don’t have mandatory paid maternity leave.
2. In the last 30 years, American worker productivity (which can be measured as the amount of work we accomplish per hour) has:
a. Declined by 75%
b. Increased by 140%
c. Increased by over 240%
3. Increased productivity means more company profits since the labor costs per item is lower. So, given your answer to question number 2 above, in the past 30 years the average overall wages in the US has:
a. Decreased by 20%
b. Increased by over 50%
c. Increased by only 16%
4. Over this same 30 year period, the average income of the top 1% of Americans:
a. Increased by 20%
b. Increased by 40%
c. Increased by over 80%
5. The number of hours everyone works in a given week is something that impacts our family life, and the nations GDP. Germany has the highest GDP in Europe. So how many more hours per year (actual time on the job) do American’s work compared to German workers?
a. We work 80 hours, or almost two weeks more per year.
b. We work 198 hours, or almost five weeks more per year.
c. We work 378 hours, or almost 10 weeks more per year.
6. In this current recession the GDP of every nation initially plunged, but no nation was hit harder than Japan. Japan’s GDP dropped twice as much as did ours. So when it comes to jobs lost, which nation has the worst unemployment rate?
a. Canada
b. Japan
c. USA
7. One last question. In 1950 nearly 35% of all wage or salary earners in America were in a union. What percentage of this group were union members as of last year?:
a. About 25%
b. Almost 20%
c. Less than 15%
If you answered each of the above question with option C you are well informed. Congratulations!
If you didn’t answer C to any of the questions, you really should read the article in Mother Jones.
In fact, we all need to be better informed so we can come together to restore a measure of economic justice in America. Here are a few additional details regarding each of the quiz questions:
1. Not only is the US only one of 6 countries that don’t have paid maternity leave, we are one of 16 nations that don’t require our workers to have time off each week. We are one of only 9 nations that don’t require businesses to offer a paid annual leave. Every one of our competitor nations provide this for their citizens.
2. While productivity has soared in the last 30 years by over 240%, the real value increase in the minimum wage since 1990 went up by just 21%. The increase in the cost of living rose 67% since 1990. Our output of goods and services in most sectors of the economy far outstrips the employment that most of these sectors create.
3. While income for the wealthiest 1% of American’s rapidly rises every year, the wealth owned by the rest of us actually declined slightly during the Regan years until about 1997. The increase since then is anemic compared to the enormous amount of wealth created by our great American labor force.
4. The rise in income among the wealthy, as large as it is, pales in compared to their rise in wealth. The top 20% of the wealthiest Americans today own almost 85% of everything leaving just 15% of the remaining wealth for the rest of us to share.
5. Not only do American’s rack up more time on the clock than our competitor nations (almost 10 weeks per year more than Germany) this doesn’t include the time we work off the clock. For example, half of us check emails on weekends and 46% of us even check work emails on days we are home sick.
6. Japan was hit twice as hard by the recession in terms of their drop in gross domestic product (GDP), yet our employment rate dropped more than twice their rate. Canada’s decline in GDP and employment initially mirrored our own (not quite as bad) but today their employment rate is higher than it was before the recession while we are worse off than all our competitor nations. Mean while, many American corporations are reporting record high profits.
7. The declining trend in union membership in America is in lock step with the decline of the middle class. The poor have faired even worse. Union workers today make about $10,000 more per year than non-union workers, yet the working public would rather trash unions than join one. The tensions between private sector employees and public sector workers is largely the result of envy by private sector workers who lost higher wages and many of their benefits when they lost their union.
How do you think we are doing as Americans? Most Labor Day articles remind us of the social battles and sacrifices prior generations have faced to bring a little dignity into our lives. We are doomed to repeat the mistakes of history if we don’t learn from them. I hope this quiz highlights where America may be headed and prompts you to consider what it will take to save the middle class. This is the real purpose for celebrating Labor, especially on Labor Day.
Note: First published in 2011, little has changed for the better since.
