by Brian T. Lynch, MSW
Home » Posts tagged 'pollution'
Tag Archives: pollution
Oklahoma Earthquakes Shaking Up Fracking Politics
Earthquakes in Oklahoma are shaking up the politics of its natural gas friendly state government. According to a June 27th article in Energy Wire, Oklahoma’s Corporation Commission, under public pressure, will start collecting information and test data on underground injection wells.

The problem is that Oklahoma have become seismically active. Between the months of October and May Oklahoma had more magnitude 3.0 or larger earthquakes (189) than California (with 139). Other reports state that the number of quakes in Oklahoma is double the number in Caliphornia. The locations of the quakes closely correspond with fracking sites. State regulators say to need more evidence of the correlation despite the stack of scientific, peer reviewed studies supporting the correlations.
The U.S. Geological Survey reported 40 earthquakes greater than magnitude 2.5 around the world yesterday as of midafternoon — six of them were in Oklahoma and three were outside this suburb of Oklahoma City.
“You can hear them coming,” said Mary Ternes, who lives near Edmond. “You can hear the rumble and then the house shakes.”
The largest quake so far measured 5.7 and killed two people back in 2011, but the risk of higher magnitude quakes is growing.
While Oklahoman’s are beginning to come out in significant numbers to public hearings to complain, state officials and regulators are taking starting to take the first step to address their concerns.
Energy Wire:
New rules on injection wells, approved by Republican Gov. Mary Fallin last week, will require operators to perform more frequent mechanical integrity tests of disposal wells and keep daily records of the amount of fluids they inject and the pressures they use.
Meanwhile, Skinner said, state regulators have told operators to shut in several injection wells for minor violations such as excessive pressure. The Corporation Commission also held formal hearings on two injection wells proposed near existing faults and asked the operators to do additional monitoring as a condition of approval. Previously, most injection well permits were approved administratively.
According to The Oklahoman newspaper about four-hundred worried resident of Edmond, Oklahoma came out to a meeting this past Thursday evening to express their fear and concerns. Many of them had been awakened by a magnitude 3.5 quake near Edmond in the wee hours of that same morning.
The Oklahoman report:
Oklahoma Geological Survey seismologist Austin Holland said there is no way to know what has caused the unprecedented increase in earthquakes in Oklahoma, although several studies have linked temblors to oil and natural gas activity, particularly wastewater injection wells.
Many residents were no happy with the answers they got at the meeting.
the problem isn’t just happening in Oklahoma it’s happening in Texas and Ohio and many other states where fracking operations are taking place. Alan Brundrett, the mayor of a small town call Azle, in North Texas, said his town has experienced an unusual number of earthquakes. He is upset by the lack of data and transparency of local fracking operations that make it hard to assess the issues.
According to an Al Jazeera report:
Brundrett said the Texas Railroad Commission would not draw a link between fracking activities and earthquakes in the meeting, but promised to investigate the matter further.
Ramona Nye, who handles media relations for the Railroad Commission, told Al Jazeera in an emailed statement that the agency “does not have the jurisdictional authority to shut down an injection well based only on the presence of a nearby earthquake.
“There has been no scientific proof that a specific well or wells have caused the Azle-area earthquakes,” she said, adding that the commission had hired a seismologist in April who is working to determine any links between fracking and earthquakes.
State geologists in Ohio have already made the case that the quake activity there is the result of fracking activity.
According to a report from International Business Times:
Fracking involves pumping water, sand and chemicals down into wells and horizontal pipes to crack open rock and extract oil and gas. Often, the wastewater created is dumped back into the ground, which according to the U.S. Geological Survey, is linked to a sixfold increase in earthquakes from 2000 to 2011. [snip]
ast month, Ohio regulators indefinitely shut down Hilcorp Energy’s fracking operation near the Pennsylvania border after five earthquakes, one of 3.0 magnitude, rattled Ohioans.
According to Oil Price.Com, an oil and energy news site:
In March, 2014. there was a study entitled “Potentially induced earthquakes in Oklahoma, USA: Links between wastewater injection and that 2011 Mw 5.7 earthquake sequence,” [snip]The study
focused its research on seismic activity in Oklahoma over the past two years and concluded that a 4.8-magnitude earthquake centered near Prague on 5 November 2011, was “induced” by the injection wells. Two subsequent earthquakes, including a 5.7-magnitude “event” the following day, was the biggest in contemporary state history, were caused by the first earthquake and existing tectonic stresses in the earth.
The growing body of scientific evidence and the growing public concern about fracking are reaching a critical mass and even the most business friendly politicians are starting to feel the ground shift.
Webliography
Coal Ash Disaster Turns Capitalists into Socialists (Again)
by Brian T. Lynch, MSW
Commentary:
Coal ash is what’s left after coal is burned. It’s a toxic stew containing heavy metals including arsenic, lead and mercury. For many years Duke Energy has mixed coal ash with water and pumped this cocktail from coal fired power plants into huge open pits. In February, one of the sludge pits located in North Carolina began releasing millions of gallons of toxic coal ash into the Dan River, a source of public drinking water for thousands of people.
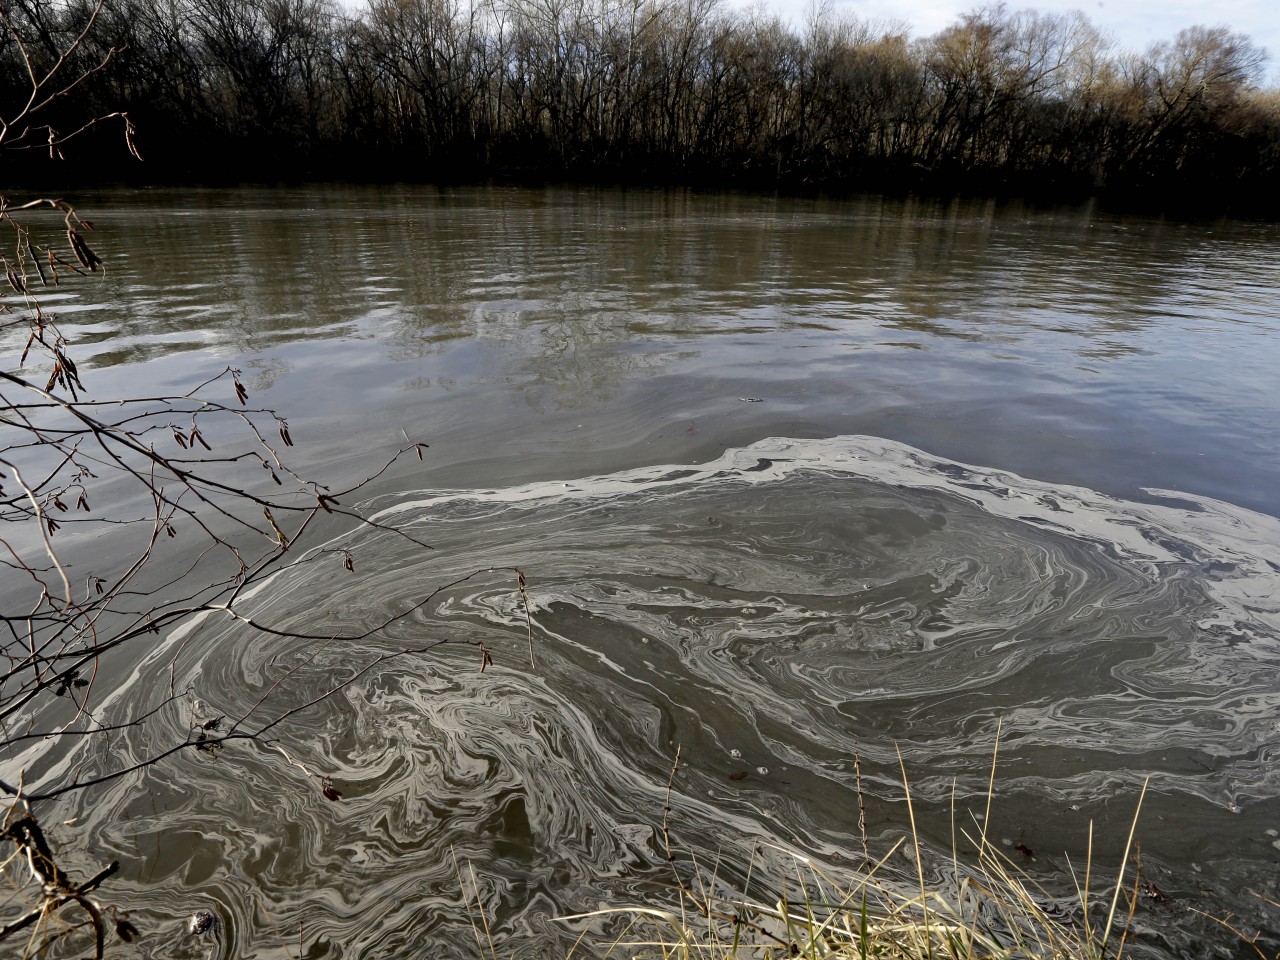
Photo and article: http://www.salon.com/2014/02/26/north_carolina_might_finally_crack_down_on_duke_energy_after_disastrous_coal_ash_spill/
Duke Energy spent millions over the years to keep government from properly regulating their waste products. For all those decades the stockholders and upper management of Duke energy have profited from this arrangement. Now that the inevitable has occurred, clean up effort will take years and cost a billion dollars. Millions more will have to be spent to correct the improper disposal problems that Duke Energy has practiced for decades.

Safely storing coal ash should have been a cost of doing business for Duke Energy all along, but they have deferred that cost to boost their profits. Now Duke Energy’s president and CEO, Lynn Good, thinks taxpayers should bear the cleanup costs. She said, “Ash pond closure has been a plan for very long time. And because that ash was created over decades for the generation of electricity, we do believe that ash pond disposal costs are ultimately a part of our cost structure.” She believes the burden of this clean up should be shared by everyone equally. (Corporate socialism? Again?)
Corporation are legally obligated to maximize profits for their shareholders. This would be fine if they were also legally obligated to paid the full cost of doing business without cutting corners. Cleaning up toxic spills is far more expensive than preventing themand regulations to enforce safe disposal are less expensive in the long run. But asking the victims of their environmental crimes to pay for cleaning up their mess and fixing their problem should not be an option.
(See also: http://www.politicususa.com/2014/03/14/republican-hypocrites-force-nc-taxpayers-pay-duke-energys-toxic-coal-ash-dumping.html )
A Word About My Free Rooftop Solar
by Brian T. Lynch, MSW
Let me tell you about my free rooftop solar energy system which I recently had installed.

I’ve wanted solar energy for a long time, mostly because my wife and I are concerned about the global warming. We didn’t convert years ago because of the high cost and slow rate of return on the initial investment. We live in Northern New Jersey which has considerably less sunlight than, say, Arizona. When I first looked into it, solar panels were far less efficient than they are today so the cost/benefit for us couldn’t be justified.
Now we are retired and improved solar panels have really lowered investment recovery times, but we may want to downsize or relocate in the next few years. We don’t want a solar energy project that won’t be paid off before we sell.
The solution for us was one of the new solar energy lease program that installs and maintains the entire system for free over a period of years. The solar panels send power directly to the power grid in an arrangement with the utility companies know as “net metering”. The solar electricity generated is deducted by the utility company from the power that I use. When we generate more power than we use the utility company gives us a credit. On months when we use more power than we generate we apply the accumulated credits and pay for any difference.
There is a catch, of course. The company who owns the system on our roof also owns the electricity it generates. We pay them for the solar electricity that we use, power which the original utility company no longer supplies. In effect, the solar energy company becomes our energy provider. For the use of our roof the solar company sells us this electricity at a discounted rate. In our case we paid nothing for the system, we will pay nothing for its maintenance over the next 20 years and we will save on our electricity bill each month. Our solar electric rate is structured to increase the amount we will save each year over time relative to our current provider. We were told that over twenty years we should save about eighteen-thousand dollars by switching to solar through this lease program.
The real beneficiary in all this is the environment. Over the course of one month we prevent over a quarter ton of carbon from entering the atmosphere. That’s three tons a year or sixty tons over the next twenty years. Through conservation measures our electric use is already half what a typical homeowner uses, so most people would save even more on carbon emissions. If everyone on our block had rooftop solar the atmosphere would be spared well over 3,000 tons of carbon a year.
How did we pick a solar energy company? I would like to say we shopped and compared, but it didn’t happen that way. I stopped to talk with a person offering information on rooftop solar at a kiosk in Home Depot. This lead me to invite a sales representative from Rooftop Diagnostic to come to our home. The representative explained how the lease option worked and confirmed that our house was a candidate for a solar based on our homes orientation and the amount of sunlight it gets. Rooftop Diagnostics only designs, installs and maintains the system for a company called Enphase Energy and neither of these two companies are affiliated with Home Depot.
Under a net metering arrangement homeowners are not allowed to produce more power than they use. This means that rooftop solar installations can’t be designed to produce more than 100% of the homeowners average annual energy use. The initial electricity rate the solar company charges is somewhat negotiable, but it should be at or slightly below what the utility company charges now. Under our Enphase Energy contract our initial electric rate will increase by 3.5% per year, which they say is half of the historic rate increase for our current energy provider. That might sound like a lot, but the inflation rate over the past 10 years is 2.3%, so inflation alone accounts for most of the increase. In our specific case, our energy charge would start at about $36.00 per month and it will end up about $67.00 per month in twenty years. The power utilities also charges a delivery service charge each month based on energy use. Since about 96% of our electricity will come from the electricity generated on our roof, our delivery service charge will be 96% less per month as well. Also, while our current electric rates vary seasonally, our solar energy rates remain the same each month.
After I first met with the solar representative, I searched the internet for more information to comparison shop, but didn’t find what I was looking for. I wanted a database listing companies that provide solar leasing options but there are none at present. A lot of companies on the internet offer solar instillations but important details are lacking. Unfortunately, internet information about solar electric companies is not as organized as is information about the sham alternative energy retailers that “compete” to sell you lower electric rates. These companies are wholesale purchasers of electricity who offer crazy gimmicks and low introductory rates to get you to buy power from them. It is a dog and pony show masquerading as a competitive energy market, but the only real competition the utility companies face is from the nascent “distributed energy” alternatives such as rooftop solar and wind power systems. Even though these true alternative energy sources are a tiny fraction of the energy market, the big utility companies are already organizing to protect their business model and market shares. If you think you might be interested in a rooftop solar system, to buy or lease, it would be wise to act soon because the current financial incentives will disappear if the energy industry has its way.
[PS: If you live in New Jersey and already have a rooftop system from Rooftop Diagnostics, they will pay you a referral fee for any new customers you refer to them. Other companies might offer similar incentives,so if you are thinking about getting a system, check with friends and family members who might benefit from this incentive program. To be clear, I am not soliciting referrals and I have no pecuniary motivation in writing this post.]
Global Cooling and a Climate Denialist Who Forgot Who Once Solved the Acid Rain Problem
The following is from an email to a friend who denies global warming as having a man made cause. He dropped of a 1975 Newsweek article on Global Cooling:
Read the article. Interesting. Thanks. Looked it up some and found this on Wikipedia, that great source of information for Rand Paul speeches:
Global cooling was a conjecture during the 1970s of imminent cooling of the Earth‘s surface and atmosphere culminating in a period of extensive glaciation. This hypothesis had little support in the scientific community, but gained temporary popular attention due to a combination of a slight downward trend of temperatures from the 1940s to the early 1970s and press reports that did not accurately reflect the full scope of the scientific climate literature, i.e., a larger and faster-growing body of literature projecting future warming due to greenhouse gas emissions. The current scientific opinion on climate change is that the Earth has not durably cooled, but undergoneglobal warming throughout the 20th century.[1]

Also, found the graph of global warming and cooling cycles for the past 425,000 years covering 5 glacial periods. The data stops at 1990 on this chart:

http://www.planetseed.com/relatedarticle/temperature-change-history
And between 1990 and the present the rate of temperature rise has exceeded the highest peeks from the past 425,000 years to about +4 degrees celcius. You will also notice that we really should be entering into a global cooling period based on the pattern you see above. Here is the current trend:

So to say the temps have been rising since the last ice age is as true as it is irrelavant. We should be heading into the next ice age, not shooting up to tempretures that haven’t been seen for a million years.
I also reminded my friend that Acid Rain was once a much bigger problem. Everyone accepted back then that it was a man made problem caused by sulfer released from coal and oil fired electric plants. A sequestration plan and cap and trade system was passed, which was a Republican plan opposed by many Democrats. But it worked and acid rain is not the critical problem it was back then. So here we are facing an even bigger man made problem and the opposition is from the party that solved acid rain with a cap and trade method that worked. go figure.
Carbon, Climate and a Mirror to Our Future
by Brian T. Lynch, MSW
If you asked most forward thinking Americans to name a disruptive challenge we face today, global warming would be high on the list. Climate changing levels of carbon dioxide have been released into the air and the impacts on weather, on raising ocean levels and melting glacier are underway. The most socially responsible among us are already reducing their carbon footprint by recycling, buying more efficient cars, better insulating their homes, buying Energy Star appliances, using florescent or LED lighting. More and more people are also taking advantage of incentive programs to install rooftop solar or wind power generation systems.
The impact from these early pioneers of change is still quite small relative to the problem, but it is significant. So significant, in fact, that the industries which release carbon dioxide to produce the energy we buy are feeling threatened. After all, every time you replace an incandescent light bulb with an LED bulb you reduce their revenue.
Our power generation and distribution companies can adapt by getting into the LED lighting business for example, or they can maladapt by killing government regulations and initiatives to reduce carbon emissions. It appears they have chosen to do both. Some energy companies are investing in wind, solar or other renewable energy technologies while others are busy hatching plans to manipulate the democratic process in order to scuttle government incentives and regulations that threaten their bottom line.
When the power generation utilities think about the disruptive challenges we face as a nation they quite literally see a mirror image of what the rest of us see. The threats they see include “demand side management” (DSM) which refers to consumer energy conservation measures, and “distributed energy resources” (DER) meaning residential power generation such as rooftop solar systems. This is explained in an national industry report released this past January by the Edison Electric Institute. Entitled, “Disruptive Challenges, Financial Implications and Strategic Responses to a Changing Retail Electric Business,” the report describes how disruptive consumer conservation and residential energy generation can be to their business. To help electric utility executives better understand the disruptive forces of socially responsible citizens it offers this useful flow chart: [http://tinyurl.com/m5py4rg]
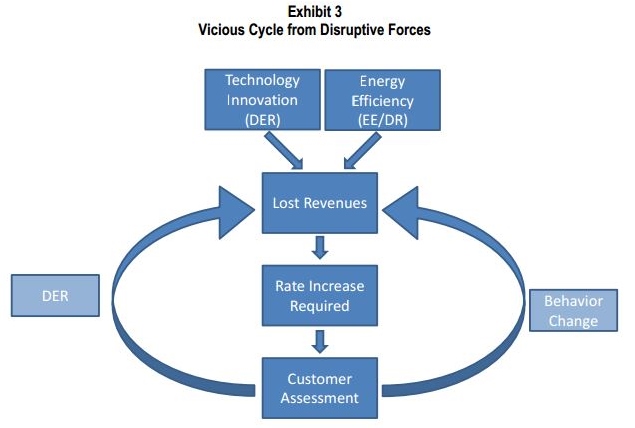
Edison Electric Institute, Washington, D.C. – www.eei.org
Another study conducted for PacifCorp was released in March of 2013 by The Cadmus Group, Inc., another D.C. based firm. This industry study looks at the potential impact of consumer conservation on corporate energy sales over the next 20 years in states served by the Pacific Power and Rocky Mountain Power Companies. The Cadmus Group defined DSM this way:
Demand-side management involves reducing electricity use through activities or programs that promote electric energy efficiency or conservation, or more efficient management of electric energy loads. These efforts may:
- Promote high efficiency building practices
- Promote the purchase of energy-efficient ENERGY STAR® products
- Encourage the transition from incandescent lighting to more efficient compact fluorescent lighting
- Encourage customers to shift non-critical usage of electricity from high-use periods to after 7 p.m. or before 11 a.m.
- Consist of programs providing limited utility control of customer equipment such as air conditioners
- Promote energy awareness and education
This report suggests that energy conservation efforts and residential power generation over the next twenty years will reduce these energy company sales by up to 15%. About 76% of this reduction will come from residential customers, mostly from conservation measures. Numbers like these are causing energy companies everywhere to start defending their business model. The Arizona Public Service Company, for example, recently funded non-profit agencies to start what looks like a grass roots attempt to turn public opinion against both rooftop solar and the states’ publically elected Arizona Corporation Commission, which has final authority over utility rates. Rooftop solar initiatives are a prime target for utility companies both because of its rapid growth and the direct way these installations impact utility company profits. The reason why conservation efforts and residential power generation may be scary to utility companies from a business perspective becomes clear when you look at the bigger picture.
The history of U.S. energy use is one of annually increasing demand. Population growth and consumer purchases of more energy reliant products guarantee increased electric demand well into the future. It remains a growing market, but the rate of growth is slowing. This has been true since the 1950’s. According to the U.S. Energy Information Administration, “The growth of electricity demand (including retail sales and direct use) has slowed in each decade since the 1950s, from a 9.8-percent annual rate of growth from 1949 to 1959 to only 0.7 percent per year in the first decade of the 21st century.” The following chart shows how the increase in electric demand is declining in this country.

US. Energy Information Agency http://tinyurl.com/nnz9rgg
Meanwhile coal continues to be the biggest fuel source for power plants. The use of coal accounts for about 42% of the electricity we generate. Coal is expected to remain predominate though 2040, although its share of the energy generation mix will fall to around 35% of the total as natural gas and renewable energy soruces grow. This means that for the foreseeable future carbon emissions and growing electricity demand will still be with us if nothing changes. Of course nothing ever stays the same. The real question is whether the energy utilities, reacting to market forces, will dominate the direction we take in producing carbon based energy or whether pressure to save the planet will rise to a point where we can achieve meaningful reductions in green house gas emissions.
FUKUSHIMA – An Unstopable Slow Motion Disaster
The image below is the most recent Fukushima radioactivity distribution map of the Pacific ocean. It speaks for itself of the scale of this disaster. Why isn’t this more in the news? What is our government doing for us?

TEPCO, the operators of the Fukushima nuclear power plant, can’t stop radiation from leaking into the Pacific Ocean. They are keeping the melted cores cool by pumping in fresh water, then storing the radioactive hot water in storage tanks. There are about a thousand tanks holding this radioactive cooling water on site, and they just keep adding more tanks. Meanwhile, there appear to be things happening to these tanks. Radiation levels in some tanks are rising. TEPCO had eight workers assigned to inspect and manage the tanks. That means, if they each took 15 minutes to inspect a tank, it would take over a week to inspect all the tanks. Now, as a result of the radiation levels being 18 times higher than they thought it was, they have hired 50 more people to look after these storage tanks. (See article below)
In addition to the storage tank problems and the unending addition of more tanks to capture the radioactive cooling water being pumped in and out of the reactor cores, there are cracks in the floor of the containment buildings leaking radioactive material directly into the Pacific. There are no viable plans to stop these leaks. There is also the impending disaster of the elevated spent fuel rod storage tanks that are at risk of collapsing.
ADDENDUM: One day after this post a new BBC news story [ http://www.bbc.co.uk/news/world-asia-23940214 ] reported Japan will spend $470 million on a plan to freeze the ground between the reactor and the Pacific Ocean. It is hoped this frozen wall will contain the radio active water leaking from the reactor containment tanks. Well holes would be drilled into the ground at certain intervals and cooling pipes connected to a massive refrgeration plant would be inserted into the holes to freeze the ground along the shore. If the heated water leaking from the reactors doesn’t defeat the cooling system, it seems to me that the wall would actually function more like a damn and would only work if the geology under the plant is just perfect for this containment method. Being a seismically active area, this seems unlikely, but we shall see.
Fukushima radiation levels 18 times higher than previously thought
Operator of Japanese nuclear power plant claims there has been no leak but has yet to discover cause of radiation spike
theguardian.com, Sunday 1 September 2013 05.22 EDT

A Tepco employee in protective clothing works around water tanks at the Fukushima nuclear power plant in June. Photograph: Noboru Hashimoto/EPA
Radiation levels 18 times higher than previously reported have been found near a water storage tank at the Fukushima Daiichi nuclear power plant, causing fresh concern about the safety of the wrecked facility.
The plant’s operator, Tokyo Electric Power (Tepco), said radiation near the bottom of the tank measured 1,800 millisieverts an hour – high enough to kill an exposed person in four hours. Tepco said water levels inside the tank had not changed, indicating there had not been a leak. But the company said it had yet to discover the cause of the radiation spike.
Last month Tepco said another storage tank – of the same design as the container causing concern at the weekend – had leaked 300 tonnes of radioactive water, possibly into the sea.
Japan‘s nuclear watchdog confirmed last week it had raised the severity of that leak from level 1, an “anomaly”, to level 3, a “serious incident”, on an eight-point scale used by the International Atomic Energy Agency for radiological releases.
Earlier, the utility belatedly confirmed reports that a toxic mixture of groundwater and water being used to cool melted fuel lying deep inside the damaged reactors was seeping into the sea at a rate of about 300 tonnes a day.
Experts said those leaks, which are separate from the most recent incidents, may have started soon after the plant was struck by a powerful tsunami on 11 March 2011.
The tsunami smashed into the plant after Japan’s north-east coast was rocked by a magnitude 9.0 earthquake. The waves killed almost 19,000 people, while the resulting triple meltdown at Fukushima Daiichi forced 160,000 people to abandon their homes.
The high radiation levels announced on Sunday highlighted the dangers facing thousands of workers as they attempt to contain, treat and store water safely, while preventing fuel assemblies damaged in the accident from going back into meltdown.
Japan’s nuclear workers are allowed an annual accumulative radiation exposure of 50 millisieverts. Tepco said radiation of 230 millisieverts an hour had been measured at another tank, up from 70 millisieverts last month. A third storage tank was emitting 70 millisieverts an hour, Tepco said. Radiation near a pipe connecting two other tanks had been measured at 230 millisieverts.
Tepco admitted recently that only two workers had initially been assigned to check more than 1,000 storage tanks on the site. Neither of the workers carried dosimeters to measure their exposure to radiation, and some inspections had not been properly recorded.
The firm responded to growing criticism of its handling of the water problem by increasing the number of workers patrolling the tanks from the current total of eight to 50.
The firm’s inability to safely store contaminated water and prevent more damage to the environment has prompted doubts about its ability to lead the Fukushima Daiichi cleanup. Decommissioning the plant is expected to cost tens of billions of dollars and last around 40 years.
Tepco recently set up a committee to focus on the water leaks and said it would seek advice from foreign decommissioning experts. The prime minister, Shinzo Abe, has said the government will play a bigger role in preventing water contamination.
The chairman of the country’s Nuclear Regulation Authority, Shunichi Tanaka, said: “We cannot fully stop contaminated water leaks right away. That’s the reality. The water is still leaking in to the sea, and we should better assess its environmental impact.”
Tepco’s handling of the leaks has drawn an angry response from local fishermen, who had to abandon plans to conduct a trial catch at the end of August. Fishermen south of Fukushima Daiichi have not been able to fish commercially since the disaster, while those north of the plant can catch only octopus and whelks.
“We think that contaminated water management by your company has completely fallen apart,” Hiroshi Kishi, chairman of the Japan Fisheries Co-operative, told Tepco’s president, Naomi Hirose, during a meeting in Tokyo last week.
“This has dealt an immeasurable blow to the future of Japan’s fishing industry, and we are extremely concerned.”
DOJ Let’s Halliburton off the Hook for Destroying Gulf Oil Spill Evidence
It seems possible that Halliburton Energy Services didn’t what it’s three-dimensional computer simulations of what when wrong in the Macondo Well blow-out to get into the hands of federal prosecutors. The simulations were destroyed and the DOJ filed criminal charges against Halliburton for this destruction of evidence. Halliburton was subsequently allowed to settle the charges of destroying evidence with the DOJ, pleading to just one count. Sen. John McCain is among those who feel that justice was not being served here. The following excerpt is from E&E News. A link to the full article is found below as is a PDF copy of Sen. McCain’s letter.
Republican questions Halliburton’s Gulf spill settlement
Jeremy P. Jacobs, E&E reporter
Published: Thursday, August 1, 2013
http://www.eenews.net/special_reports/gulf_spill/stories/1059985487
Arizona Sen. John McCain today expressed deep concerns about the Department of Justice’s recent settlement with Halliburton Energy Services Inc. over the destruction of evidence following the 2010 Deepwater Horizon oil spill.
The Republican asked DOJ several questions about how the $200,000 settlement came about and whether it is sufficient given the nature of the allegations. [SNIP]
Halliburton admitted to one count of destroying evidence and agreed to pay the maximum statutory penalty of $200,000. Additionally, Halliburton faces three years of probation and has agreed to cooperate with DOJ’s ongoing investigation into the Gulf of Mexico explosion and spill that killed 11 rig workers.
The settlement stems from three-dimensional computer simulations that Halliburton ran after the blowout on the Macondo well. Engineers were trying to determine whether BP PLC’s decision to use fewer centralizers around the well’s casings than Halliburton had recommended may have caused the blowout. [SNIP]
“Why did DOJ settle this case for such a relatively small fine rather than choose to prosecute Halliburton to the full extent of its culpability in the Deepwater Horizon disaster?” McCain asked.
McCain also raised questions about Halliburton’s decision to contribute $55 million to the National Fish and Wildlife Foundation separate from the settlement.
Read John McCain’s Letter Here: http://www.eenews.net/assets/2013/08/01/document_pm_01.pdf
Texas, Where Carbon is King
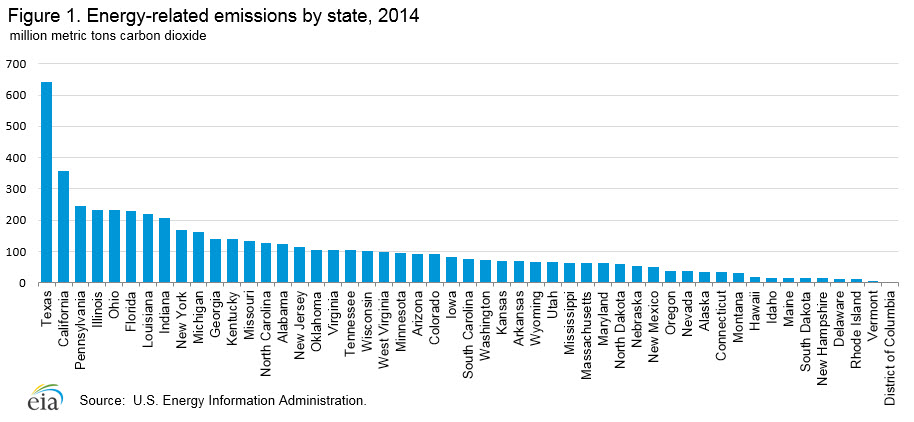
Take one look at the state-by-state CO2 admission rates and it is immediately apparent that two states stand out from the rest, California and Texas. Of these two, Texas stands head and shoulders over California. Over the span of ten years Texas produced over 7.5 trillion metric tons of CO2, That is more than the 19 lowest emissions states plus D.C. combined. Amost 12% of al the CO2 emissions generated in the United States came from Texas. Californai produced 6.6% while Pensyulvania, Ohio, Florida and Illinois each produce between 4.6% and 4% of the nations CO2 emissions.
What are the implications for carbon conservation when more than one-sixth (18.3%) of all CO2 emissions are coming from just two states? For one thing it suggests that focusing national efforts on Texas and California can produce the biggest improvements in the short term. Furthermore, the data suggests that half the states with the lowest emissions are already working harder to reduce further carbon emissions that higher CO2 producing states. Among the higher CO2 producing states, Florida, Georga, Kentucky, Missouri, Oklahoma, Arizona, Colorodo and South Carolina increased their carbon polution between 2000 and 2010. Of these, the states with the highest rate of increase were Arazona (9.9%) and Colorado (11.8%). The largest state increase in carbon emissions over ten years was Nabraska (16.0%). So focusing our national effort on just a hand full of states might be the best strategy to make the biggest and quickest improvements in our carbon footprint in the world.
US ENERGY INFORMATION ADMINISTRATION
http://www.eia.gov/environment/emissions/state/analysis/
Release Date: May 13, 2013 | Next Release Date: May 2014 | full report State-Level Energy-Related Carbon Dioxide Emissions, 2000-2010
Overview
Energy-related carbon dioxide emissions vary significantly across states (Figure 1), whether considered on an absolute or per capita basis. The overall size of a state, as well as the available fuels, types of businesses, climate, and population density, play a role in both total and per capita emissions. Additionally, each state’s energy system reflects circumstances specific to that state. For example, some states are located near abundant hydroelectric supplies, while others contain abundant coal resources.This paper presents a basic analysis of the factors that contribute to a state’s carbon dioxide profile. This analysis neither attempts to assess the effect of state policies on absolute emissions levels or on changes over time, nor does it intend to imply that certain policies would be appropriate for a particular state.
The term “energy-related carbon dioxide emissions” as used in this paper, includes emissions released at the location where fossil fuels are used. For feedstock application, carbon stored in products such as plastics are not included in reported emissions for the states where they are produced.
| Table 1. State energy-related carbon dioxide emissions by year (2000 – 2010) | ||||||||||||||
| million metric tons carbon dioxide | ||||||||||||||
| Change | ||||||||||||||
| 2000 to 2010 | ||||||||||||||
| State | 2000 | 2001 | 2002 | 2003 | 2004 | 2005 | 2006 | 2007 | 2008 | 2009 | 2010 | Percent | Absolute | |
| District of Columbia | 4.3 | 4.1 | 4.2 | 3.9 | 4.0 | 3.9 | 3.2 | 3.4 | 3.1 | 3.2 | 3.3 | -23.6% | -1.0 | 40.6 |
| Vermont | 6.8 | 6.6 | 6.4 | 6.5 | 7.0 | 6.8 | 6.7 | 6.6 | 6.1 | 6.3 | 6.0 | -10.8% | -0.7 | 71.9 |
| Rhode Island | 11.6 | 12.1 | 11.6 | 11.3 | 10.8 | 11.0 | 10.4 | 11.0 | 10.6 | 11.3 | 11.0 | -4.8% | -0.6 | 122.6 |
| South Dakota | 14.1 | 13.4 | 13.7 | 13.6 | 13.7 | 13.2 | 13.3 | 13.9 | 15.1 | 14.9 | 15.1 | 7.3% | 1.0 | 154.1 |
| Delaware | 16.3 | 15.7 | 15.5 | 16.1 | 16.1 | 17.0 | 15.8 | 16.7 | 15.9 | 11.8 | 11.7 | -27.9% | -4.5 | 168.7 |
| Idaho | 15.6 | 15.5 | 14.9 | 14.2 | 15.5 | 15.7 | 15.8 | 16.3 | 15.8 | 15.4 | 16.2 | 4.0% | 0.6 | 170.9 |
| New Hampshire | 17.5 | 16.9 | 17.6 | 20.8 | 21.9 | 21.3 | 19.4 | 19.3 | 19.1 | 17.3 | 17.0 | -2.8% | -0.5 | 208.0 |
| Hawaii | 18.8 | 19.2 | 20.5 | 21.5 | 22.6 | 23.2 | 23.5 | 24.4 | 19.7 | 18.9 | 18.9 | 0.7% | 0.1 | 231.1 |
| Maine | 22.3 | 22.4 | 24.0 | 23.4 | 24.0 | 23.1 | 21.3 | 21.0 | 19.4 | 18.6 | 18.5 | -17.1% | -3.8 | 238.1 |
| Montana | 31.3 | 31.9 | 30.7 | 32.7 | 34.5 | 35.5 | 35.8 | 37.8 | 36.1 | 32.5 | 34.9 | 11.4% | 3.6 | 373.6 |
| Connecticut | 42.8 | 41.5 | 39.9 | 42.3 | 44.4 | 43.9 | 40.9 | 40.3 | 38.2 | 36.5 | 36.9 | -13.7% | -5.8 | 447.7 |
| Oregon | 41.2 | 40.6 | 39.1 | 39.3 | 40.6 | 41.0 | 40.3 | 43.8 | 43.2 | 41.2 | 40.3 | -2.4% | -1.0 | 450.6 |
| Nevada | 45.3 | 44.6 | 41.4 | 43.4 | 47.7 | 49.8 | 41.5 | 41.8 | 41.2 | 39.7 | 38.1 | -15.9% | -7.2 | 474.3 |
| Alaska | 44.3 | 43.4 | 43.6 | 43.5 | 46.8 | 48.1 | 45.8 | 44.1 | 39.5 | 37.9 | 38.7 | -12.6% | -5.6 | 475.6 |
| Nebraska | 41.4 | 42.7 | 42.2 | 43.0 | 43.1 | 43.5 | 44.1 | 44.5 | 46.5 | 46.8 | 48.0 | 16.0% | 6.6 | 485.7 |
| North Dakota | 50.8 | 51.7 | 51.4 | 50.9 | 49.5 | 52.4 | 50.8 | 52.6 | 53.1 | 51.4 | 52.5 | 3.3% | 1.7 | 567.1 |
| New Mexico | 58.0 | 58.2 | 55.2 | 57.3 | 58.5 | 59.1 | 59.9 | 59.1 | 57.6 | 58.5 | 54.8 | -5.5% | -3.2 | 636.2 |
| Arkansas | 63.2 | 62.4 | 60.9 | 61.3 | 61.9 | 59.7 | 61.6 | 63.1 | 63.7 | 61.6 | 66.1 | 4.6% | 2.9 | 685.8 |
| Wyoming | 62.7 | 63.0 | 61.7 | 63.4 | 63.4 | 62.8 | 63.7 | 66.1 | 66.8 | 63.7 | 64.9 | 3.5% | 2.2 | 702.3 |
| Mississippi | 60.6 | 69.4 | 61.9 | 63.2 | 64.8 | 63.2 | 65.4 | 67.7 | 64.1 | 60.4 | 65.5 | 8.0% | 4.9 | 706.1 |
| Utah | 65.1 | 62.9 | 62.1 | 62.7 | 65.3 | 67.0 | 68.3 | 70.4 | 69.9 | 65.0 | 64.2 | -1.3% | -0.9 | 723.0 |
| Kansas | 76.1 | 71.8 | 76.6 | 78.4 | 75.8 | 72.0 | 72.1 | 80.1 | 76.9 | 75.0 | 75.0 | -1.3% | -1.0 | 829.7 |
| Maryland | 77.5 | 78.0 | 77.9 | 80.4 | 82.0 | 83.9 | 77.5 | 78.1 | 74.7 | 71.4 | 70.5 | -9.0% | -7.0 | 852.0 |
| Washington | 82.8 | 79.4 | 72.8 | 74.5 | 76.7 | 78.3 | 76.3 | 81.8 | 79.6 | 77.5 | 76.1 | -8.1% | -6.7 | 855.9 |
| Massachusetts | 82.2 | 82.1 | 82.9 | 83.8 | 82.6 | 84.3 | 76.4 | 80.0 | 77.2 | 71.0 | 73.0 | -11.2% | -9.2 | 875.6 |
| Iowa | 77.7 | 76.6 | 77.2 | 76.4 | 78.9 | 78.9 | 80.2 | 85.7 | 88.3 | 83.8 | 88.7 | 14.1% | 11.0 | 892.4 |
| South Carolina | 79.3 | 78.0 | 79.2 | 79.5 | 87.1 | 85.7 | 86.4 | 87.0 | 85.5 | 80.7 | 84.0 | 5.9% | 4.7 | 912.5 |
| Colorado | 84.7 | 92.8 | 90.9 | 90.0 | 93.1 | 95.4 | 96.4 | 99.2 | 97.6 | 93.7 | 96.5 | 13.9% | 11.8 | 1,030.3 |
| Arizona | 86.0 | 88.3 | 87.7 | 89.3 | 96.6 | 96.7 | 100.0 | 102.2 | 103.1 | 94.6 | 95.9 | 11.6% | 9.9 | 1,040.5 |
| Minnesota | 97.7 | 94.7 | 97.3 | 101.0 | 100.6 | 101.7 | 99.1 | 100.9 | 100.6 | 93.1 | 93.4 | -4.4% | -4.3 | 1,080.3 |
| Wisconsin | 107.5 | 105.5 | 106.7 | 104.3 | 107.1 | 110.5 | 102.7 | 104.7 | 105.7 | 96.7 | 99.2 | -7.7% | -8.3 | 1,150.6 |
| Oklahoma | 100.1 | 101.4 | 101.6 | 103.5 | 99.8 | 106.9 | 110.2 | 109.6 | 113.1 | 104.9 | 103.4 | 3.4% | 3.4 | 1,154.5 |
| West Virginia | 113.4 | 103.5 | 116.2 | 112.5 | 109.8 | 111.9 | 112.2 | 114.6 | 110.6 | 89.1 | 98.9 | -12.7% | -14.4 | 1,192.8 |
| Virginia | 122.3 | 120.0 | 118.5 | 122.2 | 126.5 | 128.5 | 122.0 | 127.7 | 117.4 | 106.3 | 109.8 | -10.2% | -12.5 | 1,321.3 |
| Tennessee | 125.2 | 124.2 | 123.2 | 120.9 | 123.0 | 124.6 | 127.0 | 126.7 | 120.3 | 100.3 | 107.1 | -14.5% | -18.1 | 1,322.4 |
| New Jersey | 121.1 | 118.5 | 118.9 | 119.8 | 122.6 | 127.6 | 120.2 | 128.6 | 124.3 | 110.4 | 115.4 | -4.7% | -5.7 | 1,327.5 |
| Missouri | 125.4 | 131.1 | 131.8 | 138.3 | 140.0 | 143.0 | 141.6 | 140.8 | 137.9 | 131.6 | 135.7 | 8.2% | 10.3 | 1,497.2 |
| Alabama | 140.4 | 132.0 | 136.7 | 137.2 | 139.7 | 141.5 | 144.0 | 146.1 | 139.2 | 119.8 | 132.7 | -5.5% | -7.7 | 1,509.3 |
| North Carolina | 147.7 | 143.1 | 144.3 | 144.7 | 148.2 | 152.7 | 147.4 | 153.6 | 149.0 | 132.9 | 142.9 | -3.3% | -4.8 | 1,606.4 |
| Kentucky | 144.7 | 148.1 | 148.3 | 143.9 | 150.9 | 153.2 | 156.1 | 156.4 | 153.7 | 143.7 | 150.7 | 4.2% | 6.1 | 1,649.7 |
| Georgia | 167.9 | 160.3 | 165.1 | 167.5 | 173.3 | 183.9 | 181.5 | 184.6 | 173.5 | 163.4 | 173.7 | 3.4% | 5.8 | 1,894.7 |
| Michigan | 192.6 | 188.5 | 187.9 | 184.7 | 187.4 | 189.3 | 178.2 | 181.2 | 175.2 | 164.4 | 165.9 | -13.9% | -26.7 | 1,995.1 |
| New York | 211.4 | 206.7 | 200.8 | 210.1 | 213.9 | 210.7 | 192.5 | 199.4 | 190.5 | 175.5 | 172.8 | -18.3% | -38.6 | 2,184.4 |
| Louisiana | 239.9 | 211.9 | 219.8 | 214.6 | 226.2 | 221.7 | 236.0 | 234.5 | 221.7 | 203.9 | 223.5 | -6.8% | -16.4 | 2,453.6 |
| Indiana | 238.2 | 228.6 | 231.7 | 236.9 | 237.8 | 236.7 | 235.0 | 234.7 | 231.5 | 208.5 | 219.1 | -8.0% | -19.1 | 2,538.6 |
| Illinois | 232.1 | 223.1 | 225.1 | 227.7 | 235.2 | 242.0 | 233.9 | 242.1 | 240.7 | 226.1 | 230.4 | -0.7% | -1.7 | 2,558.3 |
| Florida | 239.2 | 238.1 | 241.3 | 244.9 | 257.3 | 260.9 | 259.5 | 257.8 | 240.2 | 226.3 | 246.0 | 2.8% | 6.7 | 2,711.7 |
| Ohio | 264.0 | 254.5 | 260.3 | 267.4 | 262.5 | 269.7 | 263.0 | 268.9 | 261.9 | 237.6 | 249.1 | -5.6% | -14.9 | 2,858.9 |
| Pennsylvania | 276.3 | 263.4 | 270.1 | 273.0 | 276.6 | 280.0 | 274.1 | 277.6 | 264.9 | 246.0 | 256.6 | -7.1% | -19.7 | 2,958.7 |
| California | 381.3 | 385.8 | 384.9 | 389.5 | 391.5 | 389.0 | 397.5 | 403.7 | 389.8 | 375.9 | 369.8 | -3.0% | -11.4 | 4,258.6 |
| Texas | 711.3 | 704.1 | 715.8 | 706.4 | 709.7 | 677.8 | 675.2 | 676.7 | 653.3 | 624.9 | 652.6 | -8.3% | -58.8 | 7,507.7 |
| Total1 | 5,879.9 | 5,772.4 | 5,810.0 | 5,857.5 | 5,968.8 | 6,000.4 | 5,921.6 | 6,029.0 | 5,842.9 | 5,441.8 | 5,631.3 | -4.2% | -248.6 | 64,155.6 |
| 1For the United States as a country see, EIA, Monthly Energy Review, Section 12: Environment. Differing methodologies between the two data series causes | ||||||||||||||
| the total for all states to be slightly different from the national-level estimate. The amount varies no more than 0.5 percent. See Appendix A for details on | ||||||||||||||
| the data series differences. | ||||||||||||||
| Source: U.S. Energy Information Administration (EIA), State Energy Data System and EIA calculations made for this analysis. | ||||||||||||||
| Note: The District of Columbia is included in the data tables, but not in the analysis as it is not a state. | ||||||||||||||
Cancers Today From Radiation Releases by US Gov’t in 1950’s?
The following is a partial repost of an article to be found in Robert Parry’s Consortiumnews.com web site. This is an excellent site to read investigative jouralism. The article was written by John LaForge who works for Nukewatch, a nuclear watchdog group in Wisconsin. He also edits its Quarterly newsletter, and is syndicated through PeaceVoice.
Reaping the Seeds of Nuke Tests
March 28, 2013
The warnings about fallout from nuclear tests six decades ago often noted that cancers from the radiation would probably not begin appearing in large numbers for many years. But that time is now – and medical experts are wondering whether the surge in some cancers is a result, writes John LaForge.
By John LaForge
Back in the 1950s and 1960s, the Atomic Energy Commission doused the entire United States with thyroid cancer-causing iodine-131 — and 300 other radioisotopes — by exploding atomic and hydrogen bombs above ground. To protect the dirty, secretive, militarized bomb-building industry, the government chose to warn the photographic film industry about the radioactive fallout patterns, but not the general public.
In 1951, the Eastman Kodak Company had threatened a federal lawsuit over the nuclear fallout that was fogging its bulk film shipments. Film was not packed in bubble wrap then, but in corn stalks that were sometimes being fallout-contaminated.

During nuclear bomb drills in the 1950s, school children were ordered to hide under their desks.
By agreeing to warn Kodak, etc., the AEC and the bomb program avoided the public uproar — and the bomb testing program’s possible cancellation — that a lawsuit would have precipitated. The settlement kept the deadliness of the fallout hidden from farmers and the public, even though the government well knew that fallout endangered all the people it was supposed to be defending.
This staggering revelation was heralded on Sept. 30, 1997, in the New York Times headline, “U.S. Warned Film Plants, Not Public, About Nuclear Fallout.” The article began, “[W]hile the Government reassured the public that there was no health threat from atmospheric nuclear tests…” The fallout’s radioactive iodine-131 delivered thyroid doses to virtually all 160 million people in the U.S. at the time. Continue reading here: http://consortiumnews.com/2013/03/28/reaping-the-seeds-of-nuke-tests/
Principles Involved in Keystone XL Pipeline Decision
The following is an exchange between Senator Robert Menendez of New Jersey and me regarding the Keystone pipeline. Below is my response to his initial constituent letter (further below). I don’t know if this is of interest or value to readers of this blog, but I encourage everyone to be vigilant and vocal regarding this issue in the comming months. Thank you.
Dear Senator Menendez,
I thank you and your staff for getting back to me regarding my concerns about the Keystone XL pipeline. I needed to respond to what I read as an equivocal response to my concerns.
In general, the choices we make are good to the extent that they improve our future options and support the imperatives of life. Jobs today in exchange for environmental degradation lasting over a millennium is a Faustian bargain. Developing the Canadian tar sands is a bad, short term profit driven idea. The energy the planet will derive is minimal while the harm it will cause is measurable and will degrade life for generations to come.
But that decision is not in our nations hands. The only issue for us is how to minimize the environmental impact of transporting tar sands through the US. In this regard, a “black swan” analysis is the best measure in my view. Given enough time, our worst case scenarios always under estimate the actual impact of worst case events.
Therefore, any transportation options that would limit the volume of future releases of tar sands into the environment and confine spills to our Earth’ surface are far preferable to the pipe line where far greater volumes of subterranean releases are possible. I ask you and your staff to keep this in mind when evaluating the final environmental impact study and in considering how you ultimately decide.
Thank you for taking the time to consider this message.
Brian Lynch
Here is Senator Menendez’ original response to my concerns:
Dear Mr. Lynch:
Thank you for contacting me to express your concerns about the proposed Canadian tar sands oil pipeline. Your opinion is very important to me, and I appreciate the opportunity to respond to you on this critical issue.
I share your concerns about the environmental impact of tar sands and of the Keystone XL pipeline. That is why I joined several of my colleagues in sending a letter to the State Department requesting answers to a number of questions about the Draft Environmental Impact Statement the State Department had produced for the pipeline proposal. The letter raised concerns about the environmental degradation caused by oil extraction, greenhouse gas emissions, and the risks associated with transporting oil through the United States. My concerns led me to vote against a proposal to circumvent the permitting process and build the pipeline without proper review. However, I have also heard from proponents of the pipeline who have emphasized the jobs that will be created by the project, as well as its possible energy security benefits.
As you know, the Obama Administration has delayed a decision on the pipeline pending a review of alternate routes. On March 1st, the State Department issued a draft environmental review of the Keystone XL project that evaluated other methods of transporting the oil, such as trucks, barges and two train options. The report determined that all options would carry environmental risk, and that the train options would actually release more greenhouse gases than the proposed pipeline. The State Department’s report concludes that “(a)pproval or denial of the proposed project is unlikely to have a substantial impact on the rate of development in the oil sands.” Following this draft report, there will be a 45-day comment period, followed by a final environmental report and a recommendation from the Secretary of State as to whether the Keystone pipeline is in the national interest.
Ensuring that we are making smart choices about our nation’s energy future and protecting the health and safety of Americans are two of my top priorities. Please rest assured that, in my position as Chairman of the Senate Foreign Relations Committee, I will keep your views in mind as I closely monitor this ongoing situation.
Again, thank you for sharing your thoughts with me. Please do not hesitate to contact me if I may be of more assistance. I invite you to visit my website (http://menendez.senate.gov) to learn more about how I am standing up for New Jersey families in the United States Senate.
