Home » 2015 (Page 2)
Yearly Archives: 2015
America Workers Needs a Raise!
by Brian T. Lynch, MSW

The growing gap between the economy on Main Street and Wall Street, a declining standard of living, the shrinking middle class, the rise in the need for government subsidized supplemental income and social services for so many, the sense that our children won’t be better off than we are today, all of this has a common origin. They are all connected! They are all the result of wage stagnation (or suppression as I see it.)
In the period of just a few short years, beginning in 1973, employers stopped giving workers productivity raises. Since then, almost all the raises workers have received were merely inflation adjustments, not rewards for their growing productivity. All those rewards suddenly went to those at the top. The effects of this on the economy are compounded over time. Forty years of this nonsense has brought us most of the economic ills we experience today.
The fact that “growing the economy” no longer results in rising worker compensation has been lost on politicians in both political parties. In fact, almost every policy initiative to “grow the economy” has made matters worse. It has often meant slashing taxes for the wealthy (trickle down theory), granting tax breaks for big businesses, and creating tax loopholes for the “job creators” so they can do their thing. Well, their thing is to get substantially wealthier. Almost all new wealth has gone to the top while the wealthy hide more and more of their assets in tax havens. State and local governments can hardly manage to patch up the potholes on our streets because of the combination of tax breaks for businesses and subsidies for the expanding numbers of working poor families.
The Economic Policy Institute has released yet another report on why most of us are not feeling the love from the Wall Street economy. I have take liberties with their findings to condense them a bit so their impact is clearer.
The Economic Policy Institute has released yet another report on why most of us are not feeling the love from the Wall Street economy. I have take liberties with their findings to condense them a bit so their impact is clearer. For the full report, go to:
Understanding the Historic Divergence Between Productivity and a Typical Worker’s PayWhy It Matters and Why It’s Real
By Josh Bivens and Lawrence Mishel | September 2, 2015
Here is my summary of their summary of findings:
- From the end of World War II until the mid-70’s, inflation-adjusted hourly wages and benefits rose in step with increases in our growing hourly GDP, which measures our economy-wide productivity. This parity between wages and productivity created the middle class.
- Since around 1973, hourly compensation has not risen with productivity grown. In fact it almost stopped very abruptly. Net productivity grew 72% between 1973 and 2014 while inflation-adjusted hourly compensation for most of us rose just 8.7%.
- America’s Net productivity grew 1.33%annually between 1973 and 2014 while hourly worker compensation grew at just 0.20%. Since 2000, the gap between productivity and pay has risen even faster ( 21.6% from 2000 to 2014 vs. just 1.8 % rise in inflation-adjusted compensation).
- Since 2000, more than 80 % of the gap between a typical worker’s pay growth and overall net productivity growth has been driven by rising inequality. Between 1973 and 2014, rising inequality explains over two-thirds of the gap between productivity and worker compensation.
- If the hourly pay of typical American workers had kept pace with rising productivity since the 1970’s, there would have been no rise in income inequality during that period.
- Our rising productivity in recent decades provided the potential for substantial growth in wages for most American workers but this new wealth went instead to the riches segment of society.
- Policies to encourage wage growth must not only encourage productivity growth (the “we must grow our economy” argument) but also restore the link between economic growth wage compensation. Just growing the economy by itself doesn’t fix the economy for most working Americans.
Finally, economic evidence shows that the rising gap between productivity and pay is unrelated to the typical worker’s individual productivity, which has also been rising.
For the full report please go to: http://www.epi.org/publication/understanding-the-historic-divergence-between-productivity-and-a-typical-workers-pay-why-it-matters-and-why-its-real/?utm_source=Economic+Policy+Institute&utm_campaign=019280809d-EPI_News_09_04_159_4_2015&utm_medium=email&utm_term=0_e7c5826c50-019280809d-57319413#introduction-and-key-findings
Covering Politics For Profit Has Warped Our Democracy
by Brian T. Lynch, MSW
The corporate mainstream media loves those pithy and outlandish sound bites from politicians. They like candidates’ comments that slime other candidates running for office. They like covering candidates that say crazy things or react dramatically. And they especially like to cover politics from an insider perspective, reporting mostly on campaign strategies, internal intrigues and the scramble for resources. In short, they approach political coverage as if it were a spectator sport.
In truth, the more an electoral contest can be framed as a battle between rival personalities, the better it is for the corporate bottom line. It is also true that most TV viewers would rather be entertained than enlightened, and people who still buy newspapers often skip to the sports or lifestyle page if there is no hook in the headlines to catch their attention. Media companies blame the public for not caring about substance in political debate.
When pressed, media owners will admit their company is, after all, an advertizing business. The greater their viewership or readership, the more they can charge their business clients for advertizing. The business model is simple. Give the masses more of what they like to read or watch and you get a bigger audience for your business clients who will pay more to advertize on your network or in your publication.
Despite what they say to defend the integrity of their news organizations, corporate owned news outlets are deeply impacted by the drive to be more profitable. So they report more of what sells and less of what matters (not to mention what they might conceal on behalf of their sponsors).

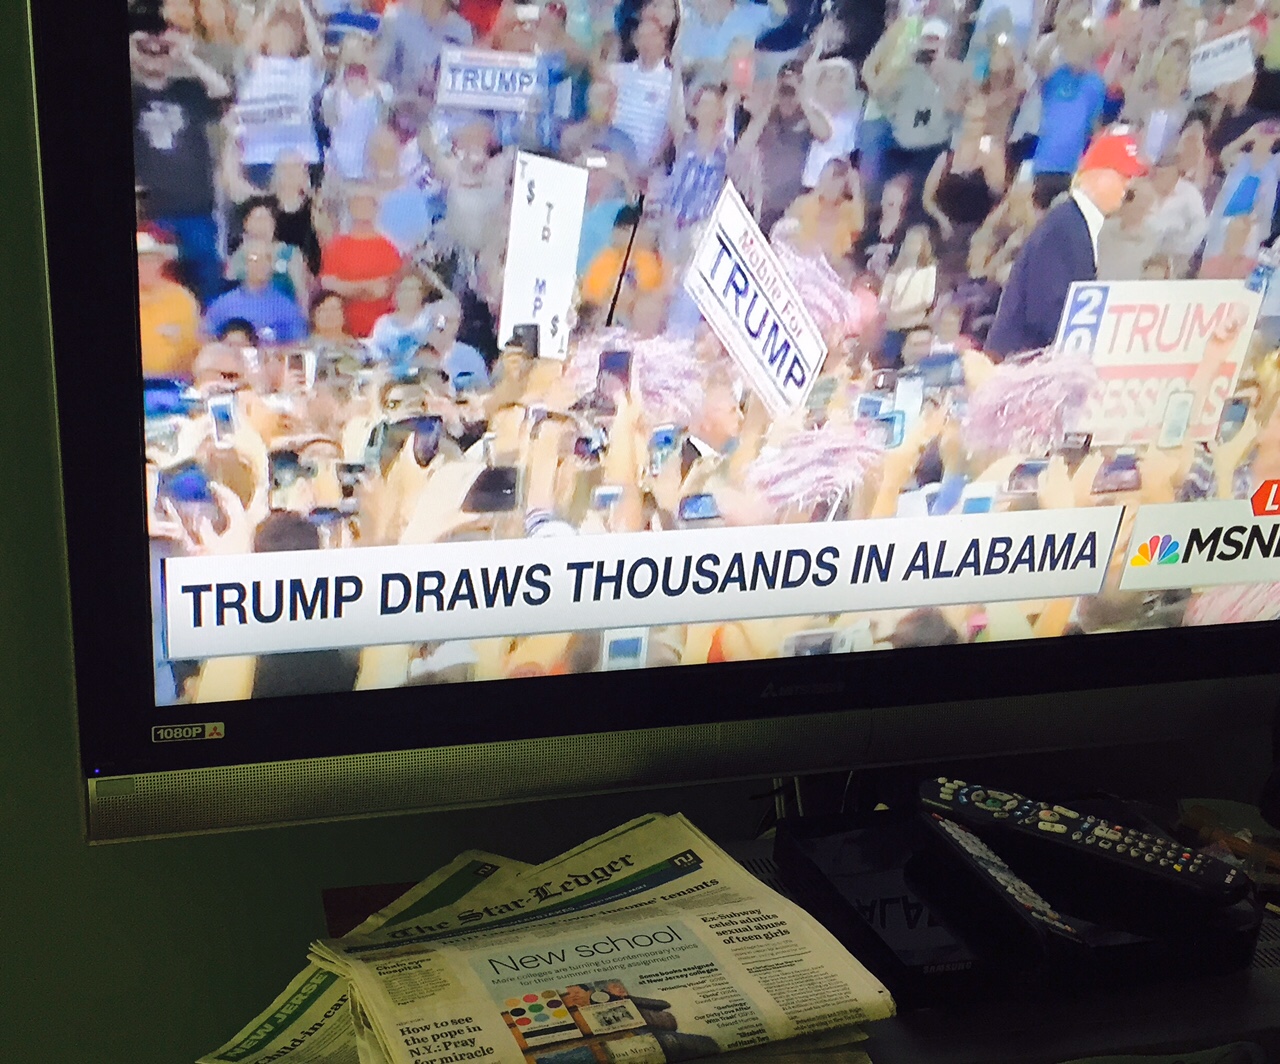
There are reasons why Donald Trump’s entertaining campaign seems be working. Politics has become a gladiatorial blood sport. An election is just another cultural event where entertainers like Trump can appear as a serious contender for President. Mass media’s profit motive has turned elections into sophomoric popularity contests while our civic consciousness is systematically anesthetized by the shock and awe by which sports and culture are marketed to us every day. The corporate media both satisfies our need to be entertained while stoking our need to be entertained at the same time. It’s almost an addiction. Meanwhile trivialities have replaced real journalism in the name of profit.
In contrast, so far at least, the Bernie Sanders campaign seems to be different. He refuses to comment on Hillary’s hair style or entertain any questions that aren’t about issues of consequence to voters. He has been cast as a radical, cantankerous old socialist with far left ideas.
Despite the absence of mainstream media attention and its efforts to marginalize him, Senator Sanders managed to attracted a lot of attention from the voting public thorough the power of his ideas. It turns out that the core issues he focuses on are far more mainstream than the corporate media presence.
Many of the issues Sanders holds, such as the need to break up big banks and tax billionaires to pay for free college tuition, hurt the financial interests of the mainstream medias’ biggest corporate clients. This creates a conflict of interest for the corporate owned media. Covering the Sanders campaign on his terms forces them to report on issues that don’t serve the financial interests of their advertisers.
The Sanders campaign also poses another challenge to the corporate medias’ business model. Much of the organizational work by his campaign is organized from the bottom up. It makes extensive and creative use of free or low cost social media platforms. This means the Sanders campaign is spending less money on media buys than any other candidate except for Donald Trump, who is getting his media attention for free.
The Donald’s antics make for good television and generates revenue for the media. It would cost a fortune for the other Republican candidates to get as much the media attention as Trump gets for nothing. That’s why they are flailing about with outrageous stunts and crazy sound bites. It’s as if the corporate media is shaking them down for money and making them dance for their supper.
Senator Sanders, on the other hand, attracts even more actual voter attention than Trump without the help of the mainstream media. Major news outlets are just starting to cover the Sanders campaign as news events in order to preserve their legitimacy as news organizations.
Aside from Hillary Clinton’s negative attention for her email investigations, Sanders has become the only other candidate cutting into Donald Trump’s beneficial free advertizing. Trump is a gladiator created and sponsored by the corporate media. Sanders is a clear and powerful voice crying from the wilderness where real people live their lives with little attention paid to the daily challenges they face.
AMERICAN ELECTIONS – Democracy At Risk
by Brian T. Lynch, MSW
NOTE: I am republishing this post from prior to the 2014 Presidential election to serve as both a primer for those new to the topic of voting issues and a baseline from which to assess progress, or lack of it, in the coming 2016 Presidential election. It contains links to a few of my prior posts on the subject of American election issues. I hope that someday a critical mass of voters will rise up and demand comprehensive voter reform.
Brian T. Lynch, MSW
Data Driven Viewpoint: What’s on my summer reading list? The United States has 54 separate elections for President every four years. There are 54 separate state and territory constitutions that each grant citizens very different sets of voting rights. Voting administration is handled very differently from state to state, county to county, etc. There is more of a national consensus on how voting be conducted in America than there is consistency in how voting actually takes place. Our collective inattention to this, the single most critical function in a democracy, has allowed powerful interests to take control of the voting processes, privatize vote collection and counting to unaccountable private companies and alter the rules to give the wealthy minority a larger voice in government.
Note: Below is a “blogliography” of posts on voting issues. If you are on Twitter or Facebook or other social media, please consider what you can do to help get this information more widely circulated. Thank you.
Who’s Counting?: How Fraudsters and Bureaucrats Put Your Vote at Risk[Paperback]
John Fund (Author), Hans von Spakovsky (Author)
Book Description
Publication Date: August 14, 2012
The 2012 election will be one of the hardest-fought in U.S. history. It is also likely to be one of the closest, a fact that brings concerns about voter fraud and bureaucratic incompetence in the conduct of elections front and center. If we don’t take notice, we could see another debacle like the Bush-Gore Florida recount of 2000 in which courts and lawyers intervened in what should have involved only voters.
Who’s Counting? will focus attention on many problems of our election system, ranging from voter fraud to a slipshod system of vote counting that noted political scientist Walter Dean Burnham calls “the most careless of the developed world.” In an effort to clean up our election laws, reduce fraud and increase public confidence in the integrity of the voting system, many states ranging from Georgia to Wisconsin have passed laws requiring a photo ID be shown at the polls and curbing the rampant use of absentee ballots, a tool of choice by fraudsters. The response from Obama allies has been to belittle the need for such laws and attack them as akin to the second coming of a racist tide in American life. In the summer of 2011, both Bill Clinton and DNC chairman Debbie Wasserman Schultz preposterously claimed that such laws suppressed minority voters and represented a return to the era of Jim Crow.
Here are some recent links from this blog on voting issues:
BLOGLIOGROPHY ON VOTING ISSUES
The sorry state of voting rights in America, a 50 state comparison
http://aseyeseesit.blogspot.com/2012/03/sorry-states-of-voting-rights-in.html
How voter ID laws might block you from voting
http://aseyeseesit.blogspot.com/2012/07/seven-ways-voter-id-could-block-you.html
Republicans have a 5% election fraud handicap built into the voting system
http://aseyeseesit.blogspot.com/2012/08/republicans-have-5-election-fraud.html
Many state are unprepared for a fair and free election
http://aseyeseesit.blogspot.com/2012/07/many-states-unprepared-for-fair-and.html
Outsourcing or privatized voting process overseas
http://aseyeseesit.blogspot.com/2012/07/outsourcing-our-privatized-voting.html
Voting rights denied to a record number of “felons”
http://aseyeseesit.blogspot.com/2012/07/voting-rights-denied-for-record-numbers.html
Ireland Scraps Electronic Voting Machines for Good
http://aseyeseesit.blogspot.com/2012/06/ireland-scraps-electronic-voting.html
Secret flawed voting software discovered and exposed
http://aseyeseesit.blogspot.com/2012/06/ireland-scraps-electronic-voting.html
Does voter suppression have a new target in Florida (Latino’s)
http://aseyeseesit.blogspot.com/2012/05/does-voter-suppression-have-new-target.html
To know your Voting Rights you must know your state constitution
http://aseyeseesit.blogspot.com/2012/03/voting-know-your-rights-know-your-state.html
Can a convicted, or formerly convicted felon vote? Lots of confusion
http://aseyeseesit.blogspot.com/2012/04/can-convicted-felon-vote-major.html
Colorado sues for voting privacy, but do we have that right
http://aseyeseesit.blogspot.com/2012/02/colorado-group-sues-for-vote-privacy.html
A private company has the first peek at election results
http://aseyeseesit.blogspot.com/2012/02/company-wprivate-access-to-vote-totals.html
Voter suppression in America to get a hearing at the United Nations
http://aseyeseesit.blogspot.com/2012/03/voter-suppression-in-america-to-get.html
Caucus voting flubs highlight election system flaws
http://aseyeseesit.blogspot.com/2012/02/caucus-voting-flubs-highlight-our.html
South Carolina out sources vote count to Spain
http://aseyeseesit.blogspot.com/2012/01/south-carolina-outsources-vote-count-to.html
A voters “Bill of Rights”
http://aseyeseesit.blogspot.com/2011/10/voters-bill-of-rights.html
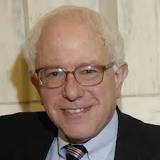
The Piano Man – Hank Shapiro

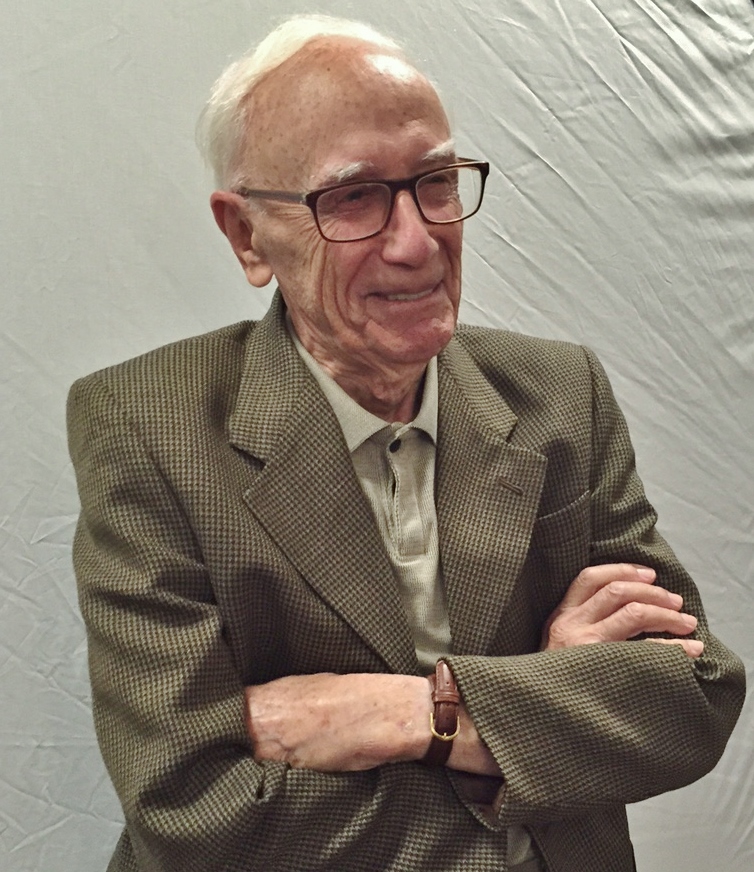
Henry Shapiro (my father-in-law) began his musical career around 1935 or 1936. He learned his craft by taking lesson in New York City with the same piano teacher who taught George Gershwin. At age 16 he had his own 12 piece big band, the Henry Shapiro Band. He played in various venues in Morris County and Northern New Jersey, including various dance halls around Lake Hopatcong. He is a life long member of the Dover Musician’s Union. He moved to Florida in the 1970’s where he continued playing at private parties and restaurants in the Fort Meyers area. His love of music and entertaining as kept him young. Now, at the age of 94, he is back in Morris County, NJ where it all began for him, playing gigs wherever he can. The You Tube video above was from a June 12, 2015 performance at an open state event sponsored by the Folk Project in Morristown, New Jersey ( http://folkproject.org/ ).
So click on the You Tube link and enjoy. Let me know what you think or contact me if you would like to get in touch with Henry.
Thank you.
The Village We Left Behind
by Brian T. Lynch, MSW
I recently returned from a trip to my father’s birthplace in County Meath, Ireland where I took a walk around the village of Athboy. This is the town nearest Kildalkey where he grew up. Like so many villages in rural Ireland it is still owned and run by local inhabitants. There is a quaint little supermarket first opened by Ollie Byrd, my father boyhood friend. It’s now run by his son since Ollie passed away a few years ago.

Just up the sidewalk is Faulkner’s men’s shop owned and operated by Brian Faulkner, a cousin to my cousin, Sean. Three doors up the street is Faulkner’s Fashion House for woman, owned and run by his sister, Ger Faulkner. Across the street is the historic Darney Hotel where you can get a proper meal and a spot of tea in homey, low chic surroundings . On certain evenings you can go there to enjoy traditional Irish music in the hotel’s pub.
There are a handful of other pubs in town named after their proprietors. There is a family owned hardware store, a bakery, a post office that also serves as a general convenience store and a little gift shop run by a mother and daughter where you can buy small gifts for your friends and family on those special occasions.
The village is alive with shoppers. The streets are abuzz with cars, lories, public buses and farm tractors towing wagons of silage or farm equipment down the main street on their way from one field to the next. It is a place where people still know their neighbors and customers are greeted by their first name more often than not. Relationships are the real treasure you will find here.
It was a striking contrast to the sterile and impersonal world of cookie cutter malls and brand name store fronts in America today. It reminded me that we once had local commerce centered in small towns all across America. We had more civic pride back then, and a deep sense of connection with the people in the community where we shared our time and place. This is a way of living that is quickly disappearing. It is under siege in Ireland as it is everywhere around the globe wherever corporate profits can be extracted from local economies and brand recognition can replace familiar faces. In the process we have lost our connections between farmers and food, craftsmen and products, business owners and commerce.
I was told that all meat sold in Ireland had the name of the farmer and the farm where the livestock was raised. People in Ireland want to know exactly from where their food comes. So I wandered into Brogan’s Butcher Shop across from the post office to look for farm names on the products in the meat case. I was disappointed to find none. Had I been misinformed?
I asked the butcher behind the counter about this. He proudly pointed to the wall where a certificate of origin hung on a nail as he explained that all this meat came from his own family’s farm. “If you want to see a farmer’s name on a piece of meat you’ll have to head back to Ollie Byrd’s,” he said.
Contrast this with the US House of Representatives who on June 11th of this year passed a bill that would eliminate a law requiring country of origin labeling on all U.S. meats. “It sounds like you are heading backwards,” he said to me when I told him this. Indeed it does.
I read that over 90% of all American’s want to know from where their meat comes, and most people I know would love to know more about where all their food is grown. We can’t have real competition in the food industry as long as information like this is hidden from us. So what is behind the passage of this bill to block COOL (country of origin labeling)?
It turns out that Canadian and Mexican meat industry trade groups have sued the United States in the WTO (World Trade Organization) over COOL, saying it constitutes unfair trade practices under international treaties. Specifically, the WTO ruled that:
“The compliance panel found that the amended COOL measure violates Article 2.1 of the TBT Agreement because it accords to Canadian and Mexican livestock less favourable treatment than that accorded to like US livestock. In particular, the compliance panel concluded that the amended COOL measure increases the original COOL measure’s detrimental impact on the competitive opportunities of imported livestock in the US market, because it necessitates increased segregation of meat and livestock according to origin; entails a higher recordkeeping burden; and increases the original COOL measure’s incentive to choose domestic over imported livestock.”
This is what we are up against. Giant international corporations battling each other beyond the reach of sovereign countries to create a world more suitable for their financial conquests. Congressional supporters of the measure to eliminate COOL are seeking to avoid the $3.6 billion in potential retaliatory tariffs sought by Canada and Mexico. In the mean time, the US livestock census is at near record lows while beef prices keep climbing into record high territory. What people want no longer matters.
Understanding Social Power – Part 1
by Brian T. Lynch, MSW
Part 1 – What is “social Power”
Social power is the force that directs and coordinates human action. It’s that simple, and yet that complex. The non-random acts of others that benefit you in some way is the active form of social power. It is the power to get things done or to stop others from doing things. It is the power to influence the behavior of others to suit your interests.
On a grand scale, social power is the force that makes, grows, sells, protects and transports things. It is the force that gets done all the work it takes for people to live together and thrive. Whenever people collaborate or coordinate, or whenever people act to block the coordination or cooperation of others, these actions are examples of social power at work.
Actions by another can benefit you directly, such as when a volunteer helps you get elected to the school board or when an employee puts in a day’s work at your store. On an personal scale, your social power becomes manifest when a friend drops by to help build your deck or students you teach line up in the hall at your command. The tangible benefits of social power can also be indirect, like when the town paves the road in front of your house or your local grade school wins an academic award thereby raising property values in your community.
Just like energy and power in the field of Physics, social power has both the active state described above and a potential state. Social power is fungible and can be accumulated (stored), traded, transferred to others or spent in exchange for human action. In its potential form, and in certain social contexts, it may rightly be referred to as social capital. At each level of social complexity, social capital takes many forms, each with its own set of symbols and rules.
Think for a moment about all the ways you can influence loved ones, or your peers, the people where you work or play, your customers, the people you meet and so forth. On an interpersonal level you have bonds of love and friendship, personal charm and charisma, verbal skills, maybe an attractive appearance, intelligence, collaborative skills and so on. On a larger scale you have natural abilities, acquired skills, knowledge, wisdom, social connections, organizational position or authority, fame, prestige and your personal accumulation of wealth, to name a few examples.
Wealth is an interesting aspect of social power because it can be more easily quantified. This sets it apart from fame, skill or most other sources of social power. It is easy to transfer or spend. Wealth is as much a medium for the exchange of social power as it is a medium for the exchanges of goods and services, yet wealth as a form of social power is often overlooked. It is studied extensively in the field of Micro and Macro Economics but it is not well integrated into the larger social economy. (More on this topic in part 2 at a later date.)
On a still larger scale, there is great social power in our big human organizations and institutions of government and commerce and religion. There is the coercive social power of great armies and law enforcement agencies. There is immense power organized around ideologies and religions that greatly influence the social behavior of millions of people. There is the power in our great institutions of learning and enormously influential multi-national corporations.
Every organization and every individual has some social capital to influence the behavior of others. A fewer number of groups and individuals have vastly more social capital than most of us. We recognize these powerful people when we are in their presence and it alters our own behavior. Powerful people are able to turn everything to their advantage, which is why they are both feared and respected.
The sum of all actions or potential actions on your behalf, if it could be calculated, would be a measure of your own social power. Most of us have more than we think and all of us could use it to better advantage if we understood it better. But no matter how you calculate your social power, it cannot be precisely measured. There is a perceptual dynamic to it that defies attempts to measure it.
These examples illustrate that social power can be accumulate, converted to other forms, transferred to other people or can be used to coordinate the physical actions of others. These operations are essential to an understanding of social power. But the important starting point is understanding that social power is the force that directs and coordinates human actions.
In the next parts of this discussion I will discuss:
– How social power operates at various scales of social complexity
– How it is accrued, converted for other forms, transferred between people and communicated or spent to bring direct coordinated actions.
—————————————————–
Please see the Introduction to this series at: http://aseyeseesit.blogspot.com/2015/04/understanding-social-power.html
Cycle of Death for Our Republic
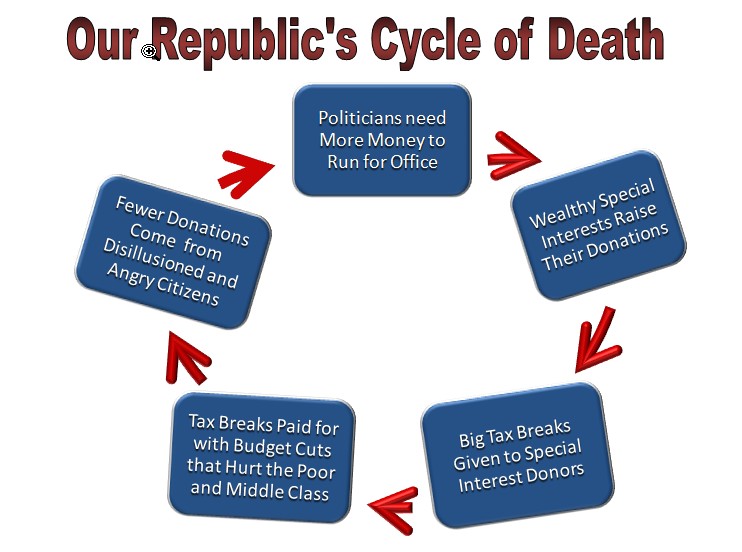
Any questions?
Un-Taxing the Rich is the Root Cause of the Public Pension Crisis
by Brian T. Lynch, MSW
What follows is a letter I wrote to New Jersey’s principal newspaper, which is constantly trying to convince us that the huge pension deficits created by bad public policy decisions (or perhaps by intentional public union busting strategies) can’t be fixed without dismantling the whole system and starting over. All options to do this create great sacrifices by hard working servants of the people who were promised pensions in exchange for lower lifetime wages than the private sector would be paid for comparable work.
“Taxing the rich won’t solve pension problems” claims the Star-Ledger in its editorial. Their point is that the “millionaire’s tax” vetoed by Gov. Christie wouldn’t plug the current pension gap.
Money is fungible. Whenever tax revenue is deleted from the budget, someone’s ox has to be gored. For decades that ox belonged to State employees. Their pensions is part their wage package and the reason their overall compensation is roughly parallel with the private sector. Not funding it was a deliberate choice.
Another fact hidden in plain view is that revenue deleted from the budget doesn’t have a line item to remind us of what’s missing. We end up blindly subsidizing profitable corporations instead of properly compensating ordinary folks who work for us.
It’s disingenuous for politicians (or the Star-Ledger) to speak of pension reform without also discussing the massive tax breaks that created this crisis. If tax cuts for businesses and people who don’t need it were rescinded, there would be plenty of revenue to fund the pensions.
New Data Exposes Racial Bias in Fatal Police Encounters Nationwide
by Brian T. Lynch, MSW

Michael Brown was killed on the streets of Ferguson, Missouri, touching off community riots. Michael was African-American. The officer who shot him was white. Frustrations and local suspicions of racially biased policing, since then confirmed by a federal investigation, was simmering in that community for years. There have been other recent cases in the national news. There was the murder of Walter Scott of North Charleston, South Carolina, the sad shooting death of 12 year old Tamir E. Rice of Cleveland, Ohio and the choke hold death of Eric Garner in New York, to name just a few.
These shocking cases have focused national attention on what seems like a rash of questionable police killings involving minority citizens. Until now there has been no way of telling if the perception of police bias is due to media bias, statistical flukes or real patterns of differential policing in minority neighborhoods. A big question hanging in the air:
Is the use of deadly force disproportionately used in Black or Latino communities?
I will answer that question below using newly gathered data. The question can’t be answered by standard government statistics. There is no mandatory or systematic reporting of police killings in America. With 17,000 law enforcement agencies acting mostly on their own, fatal encounters are seldom noticed beyond local news accounts, the bulk of these relying on local police statements. There is no public notification requirement when people are killed by police.
That’s why it is a big deal that several citizens have begun scanning the internet for local news accounts of police action fatalities and compiling a listing of them on their KilledByPolice.com Website. Shocking preliminary findings show that in just 23 months of record keeping 2,181 people were killed in police encounters. For some perspective, there were only 70 police killings in the past 90 years in Great Britain.
This analysis only looks at three demographic categories, White (non-Hispanic), Latino and Black. All other demographic categories are excluded because they are still too few in number for a meaningful analysis. The population totals and fatality data used here are only for these three study groups. This is not to diminish the importance of other demographic group, especially in the fatality data, but that analysis will have to wait until more data is available. Also, local news accounts often do not report the race, ethnicity, or even the identity of person killed. This forces us to assume unreported demographic information, if known, would reflect the population as a whole rather than the fatality patterns observed below. This data includes all cases where a civilian is killed in a police action whether accidental, justified or unjustified.
Below are four comparative bar graphs for each of the US Census regions of the United States. It compares the distribution of the total White, Latino and Black population in the region with the distribution of people killed in police encounters within the region.
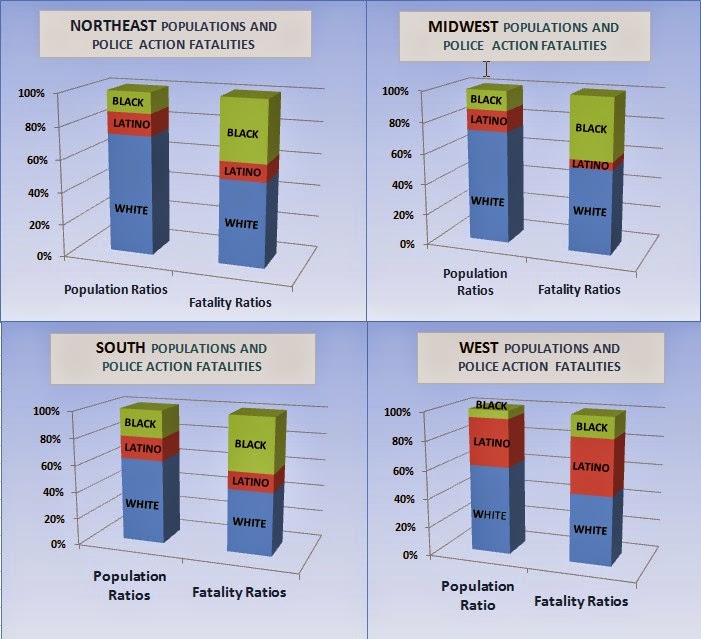
If police action fatalities were random events then the demographic makeup of people killed should reflect the population. The four regional graphs above almost speak for themselves. In every region of the country Blacks comprise a significantly larger portion of those killed in police encounters than expected based on regional demographics. You will notice that Latino populations are also over-represented among police action fatalities in the West. I will discuss results in each region below and show some of the state data that may be significant in understanding these findings.
THE NORTHEAST
In the past 23 months there was a disproportionate number of police involved killings in the African-American community in the Northeast Region. There were 197 instances where people were killed in their encounters with police. This is the lowest number in any region, but this is also the region with the smallest population (for these three racial/ethnic categories). In 150 of these cases the ethnicity or race of the person killed was reported in the press. Blacks make up 13% of the population in the Northeast and 37% of police action fatalities. This is an unrepresentative finding. The numbers for Latino’s killed by police actions was slightly under represented. They represent 13% of the study population and 11% of those killed by police. Because the Northeast has fewer police action fatalities several states have fatality numbers too low for meaningful analysis. The three exceptions are New York, New Jersey and Pennsylvania.

New Jersey had more Black citizens killed by police than White citizens in the past 23 months. There were 31 police action fatalities, 25 of which where race or ethnicity was reported. Blacks make up 15% of New Jersey’s population but 52% of police action fatalities in this data. Twenty-five cases is really too confirm a finding, but the trend is startling.
In Pennsylvania and New York there were higher numbers of fatalities than in New Jersey and evidence that these were also disproportionately Black lives,
Pennsylvania had 52 police action fatalities, 14 where race/ethnicity was not reported and 38 others. Blacks make up 11% of the three racial ethnic groups in this study and 34% of those killed in police actions. Latinos are 6% of this population and 8% of the fatalities.
New York had 56 incidents, 14 where race wasn’t reported and 42 others. Blacks comprise 17% of the study population and 43% of those killed in police actions. Latinos represent 19% of the study population and 9% of the casualties in police actions in the past 23 months.
The number of fatalities in Massachusetts were also disproportionately black, especially relative to the population, but the total number of police action fatalities was too small to be sure of the significance. Massachusetts had 26 police action fatalities of which race was not reported in 7 and 19 others where it was reported.

In the remaining states of Connecticut, Maine, New Hampshire, Rhode Island and Vermont the total number of people killed by police was 32 with 6 cases where race was not identified. Of the other 26 cases, 18 were White, 4 Latino and 4 Black.
THE MIDWEST
In the past 23 months there were 339 instances where people were killed in their encounters with police. In 255 of these cases the ethnicity or race of the person killed was reported. Blacks and Latinos each make up 13% of the study population but Black citizens made up 40% of all those killed in the Midwest during police encounters. Latinos were less likely to be killed in police actions. They were just 5% of the casualties. The states that had the most fatalities and largest disparities in the region were Ohio, Illinois and Missouri.

Ohio’s study population here is 13% Black yet 55% of those killed in police actions were Black. No Latinos were reported killed. There were a total of 61 cases where citizens were killed by police actions. Race was not reported in 10 of those cases.
Illinois had 63 citizens killed in police actions. No race or ethnicity was reported in 37% of those cases. Blacks are 15% of the study poplation but 55% of the police action fatalities. Latinos fared better, being 17% of population and 12% of the casualties.
In Missouri there were 49 citizens killed in police actions of which race was reported in 37 incidents. Blacks make up 12% of the study population and 49% of the police action fatalities.
In Wisconsin, Michigan and Indiana the rate of Black fatalities in police encounters were also higher than expected, but the number of individual cases were to few for individual analysis. The numbers for these three states were combined. The result yielded 87 cases, 61 of which where race was reported. Of those 61 cases 36 casualties were White, 2 Latino and 23 Black. Blacks make up 11% of the population in this combined group and 38% of the fatalities in police encounters.

In the remaining states of Iowa, Kansas, Minnesota, Nebraska, North Dakota and South Dakota the combined total of people killed in police actions was 46 with race not reported in 15 cases. No minorities were killed in North Dakota or South Dakota. Blacks and Latinos were 15% and 11% of the total casualties and Whites were 74% of the total.
THE SOUTH
The Southern Region is the most populated of the four regions. There are many states with over 30 incidents in 23 months, partly because of higher populations. There were 890 cases where people were killed in their encounters with police. In 652 of these cases the ethnicity or race of the person killed was reported. The Southern Region has the highest population, the highest number of police action fatalities and the highest percentage of African-Americans in the population. Blacks make up 20% of the population and Latinos another 17%. White, non-Hispanics are 63% of the total population. Black casualties of police actions made up 40% of the total cases in the prior 23 months. Latinos had 13% of the police action fatalities.
Alabama had 31 police action fatalities in 23 months where race was identified. Blacks represent 27% of the study population and 55% of the casualties. There were 8 additional cases where the race of the victim was not identified. No Latinos fatalities were identified.
In Florida there were 140 police action fatalities with a very significant 35 cases in which race or ethnicity was not identified. Blacks make up 17% of the study population and 38% of the casualties while Latinos are 23% of the population but only 13% of the casualties.
Georgia had 42 cases with 18 additional cases were the identity of the casualties were not provided. Blacks make up 32% of the state and 55% of the police action fatalities. Latinos make up 9% of the study population and just 2% of the casualties.
Louisiana had 27 police action fatalities where race the race of the casualties were know and 13 where this information wasn’t initially reported. Blacks are 33% of the population and 595 of the casualties. Latinos were evenly represented at 4% of both the study population and the casualties.
Maryland had 31 cases in 23 three months plus an additional 12 where race was not identified. Blacks make up 23% of the population but 68% of the police action fatalities. The highest ratio in the nation. Latinos represent 9% of the study population and 6% of the casualties.

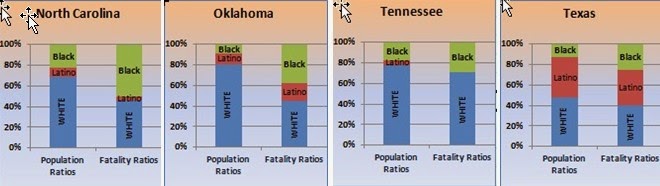
North Carolina had 48 cases and 11 more where the racial or ethnic identity was not reported. Blacks make up 22% of the state and 55% of the police action fatalities. Latinos are 9% of the state and 4% of the casualties.
Oklahoma, with the smallest population in the South, had 45 police action fatalities where race was identified and another 12 where it wasn’t. Just 9% of the population is Black and they represented 38% of the fatalities. Latinos make up 10% of the population and 18% of the police action fatalities.
Tennessee had 31 incidents and 9 more cases where the racial identity was undisclosed. The state is 17% Black and Blacks made up 29% of the fatalities. Latinos are 5% of the population but 0% of the fatalities.
Texas has a large population and there were 153 police action fatalities where ethnicity or race of the casualties was identified. There were 51 other cases where this information was not reported in the local press. That is the highest number in this category. Blacks are 12% of the population and 25% of the police action fatalities. Latinos are 40% of the study population but only 37% of the casualties. The high number of cases where race or ethnicity was reported could substantially change these percentages.
West Virginia is note worth for having no minority police action fatalities. There were only 13 cases with 5 White casualties identified. The state is mostly White.
THE WEST
Turing attention to the West, there were 697 people killed in police encounters in the past 23 months. Of those, the race of those killed by police was reported in 491 cases. In this Region Blacks make up 6% of the study population and 14% of the police action fatalities. This is the lowest percentage of Black casualties in absolute terms but still over twice what it should be by chance alone. The Western region, on the other hand, has the highest percentage of Latinos of the four regions. It is also the only region where Latinos have a higher rate of police action fatalities than chance would allow. Latinos comprise 33% of the population and 38% of people killed in fatal police encounters.
Arizona had 94 police action fatalities in the past 23 months and the race of the person killed was released in 67 cases. Blacks comprise 5% of the population under study here and 9% of the casualties. Latino fatalities were more disproportional. They make up 32% of the population and 42% of the people killed in police encounters.
California had the most civilian fatalities in police encounters in the country and is also the most populated state. It had 351 police action fatalities of which the race of the casualties was reported in 251 cases. Blacks represent 7% of the population and 20% of the police action fatalities. Latinos are 45% of the population and 47% of the casualties.
Colorado had 43 police action fatalities of which 16 cases provided no information on race. Blacks are 4% of the population and 7% of the casualties in a police encounter. This is among the most representative of Black demographics for any state among high population states. On the other hand, Latinos comprise 22% of the population and 45% of the police action fatalities. This is the most disproportional rate for this group nationwide.
Nevada had 32 people killed in police encounters of which race was not reported in 12 (38%) of the cases. Blacks comprise 9% of the population and 15% of the casualties in fatal police encounters, while Latinos represent 30% of the study population here but 15% of the fatalities.

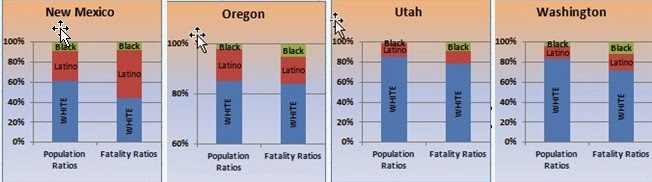
New Mexico had only 28 fatality incidents and just 3 cases where the race of the casualties was unreported. Blacks comprise 2% of the study population and 8% of those killed in police encounters. Latinos are 52% of the population and 48% of the civilian casualties.
Oregon had 29 fatal police encounters, 19 in which the race of the people killed was reported. Blacks are 2% of the study population and 5% of the casualties. Latinos make up 13% of the population and 11% of those killed in police encounters.
Utah had 25 police action fatalities, 23 in which race was identified. Blacks account for about 1% of the study population and 9% of the fatalities in police encounters. Latinos are 14% of the study population and 13% of the total, which is essentially a representative proportion.
In Washington State there were 58 cases were civilians were killed in police encounters. In 23 cases (43%) the race of the persons killed was not reported. Blacks comprise 4% of the study population and 11% of the fatalities. Latinos represent 13% of the population and 17% of the fatalities.
Wyoming had only 4 police action fatalities and all of the casualties were White.
Discussion
If my hypothesis is to disprove that African Americans are more likely to be the casualties in fatal encounters with law enforcement (the null hypothesis), then this journalistic analysis failed to prove it.
It might still be true that there is nothing to the perception that Black Americans are more likely to die in police encounters, but the evidence here strongly suggest the contrary, they are a disproportionate class of people killed in police encounters in virtually every region of the country. It can be said that this isn’t true in every state, but that is of little comfort to minority communities.
This review of this newly collected data supports the suspicions that minority communities may be subject to differential police tactics or over-policing. The depth and breadth of these finds are disturbing. Blacks are simply more likely to be killed in police encounters in every area of the country and a majority of state. Latinos are also more likely to be among the fatalities in the West. Fatalities in these police encounters are also overwhelmingly men. The gender basis of these findings have yet to be studied or even noticed, One might be tempted to think this higher rate of Black men being killed in police encounters is connected to so many young Black men being unemployed and on the streets, yet the average age of those killed by police is 36.9 years. This is almost exactly the average age in the U.S. population. This means there is no statistical bias due age which rules out a young black male theory.
Another factor some folks bring up is the high crime statistics in minority neighborhoods and a greater chance that minority folks act like criminals. First of all, there are very few crimes that carry a death sentence, which is was is administered by law enforcement where there are safer ways to apprehend a suspect. And crime statistics are mostly a sensitive measures of policing policies, tactics, training, law enforcement priorities and the culture or attitudes of those doing the policing. If you target any given group to enforce laws their crime statistics will climb. A secondary result of economic disparity and heavy handed policing is the contempt for the law that is often seen in poor and minority neighborhoods. The latter follows as a consequence from the former in nearly all cases.
As for minority folks acting like criminals, who is making that judgement and what is the evidence?
I have reviewed dozens of specific recent cases at this point and can say that some of these police action fatalities are completely justified but in most cases there aren’t enough detail to form any judgments. There are also many cases where it seems law enforcement had other options to avoid the use of deadly force. Very few cases involve independent investigations of the incident or judicial reviews. They rely on mostly local police accounts with no eyewitnesses or video cameras. The police are policing themselves.
To the best of this knowledge this is the first look at what is probably the most comprehensive collection of information about police action fatalities. This is more a journalist exercise than a scholarly study and this information badly needs a more scholarly treatment. Still, I believe the original question asked here can be tentatively answered in the affirmative:
The use of deadly force is disproportionately used in the Black community in every region of the country and in the Latino community in the West.
The Facts About Police Action Fatalities in America
by Brian T. Lynch, MSW
On April 4, 2015, Walter Scott, an African-American resident of South Carolina, was stopped for having a broken tail light. He was stopped by Officer Michael Slager, a White, North Charleston police officer. A few minutes later Scott was shot several times in the back while trying to flee. The incident was presented as a justifiable use of force by authorities until a videotape surfaced Slager calmly aiming his service weapon and firing into the back of Mr. Scott as he was running away. It was national news.
Stories of people killed by local police action rarely get national attention. Unless there is some dramatic twist or shocking video, the incidents are only reported in hyper-local community newspapers. The only sources for these reports are usually a police spokespersons and sometimes friends or grieving family members. When cases like the Scott shooting do capture regional or national attention they also raise significant, unanswered questions. Just how many citizens are killed in police actions in this country? Is this rare? Who is keeping track of the numbers? Does this sort of thing happen mostly in certain areas or departments? Is it just a few bad apples or are there larger patterns?
There are no national databases to track civilian deaths that result from police actions. The FBI does maintains a partial database of “justified police homicides,” but reporting by state and local authorities is voluntary. Only 750 of the more than 17,000 law enforcement agencies in this country submit their data. This limited reporting yields about 400 police homicides per year,
Almost two years ago a group of dedicated citizens began searching through local newspaper accounts of police involved civilian deaths throughout the country. They started a Website called KilledByPolice.net. They compile names of civilian casualties and added links to the initial news accounts. They also open a Facebook page on each person killed to post follow-up news accounts and to collect any local comments about these cases. Most of these fatalities are police homicides, justified or otherwise, but the data also includes murder/suicides by police officers, fatal DWI accident where the officers were intoxicated, police assisted suicides of mentally ill persons and other such categories. This effort turns out to be the most comprehensive data resource I’ve seen so far on police action fatalities. Based on this raw material I have begun my own analysis of the data.
Here is a brief summary of my initial findings to date.
Between May 1, 2013 and April 4th, 2015 there were 2,181 people killed by police officers in the United States. That works out to around 95 per month or 3 police action fatalities per day. There is clearly a gender bias in police action fatalities. Almost all are males, 2,044, with only 135 females killed in this 23 month period. In six other case the gender was undisclosed.
The full identity of 565 fatality victims were not disclosed to the media as of yet. The average age of the known fatality victims is 36.9 years, which is also the national median age of the population. This means that there is no age bias in police action fatality. Younger people are not more likely to be killed in a police action, for example.
Regarding race and ethnicity, Latino’s make up 18.7% of the general population and were 17% of the fatality victims during the past 23 months, suggesting their rate of police involved fatalities is proportional on a national scale. This may not be uniformly true in every locality.
Whites make up 77% of the population but only 48.1% of the victims. African-Americans make up just 13.2% of the general population but 30.5% of the total fatalities. This clearly suggests a racial bias in police action fatalities.
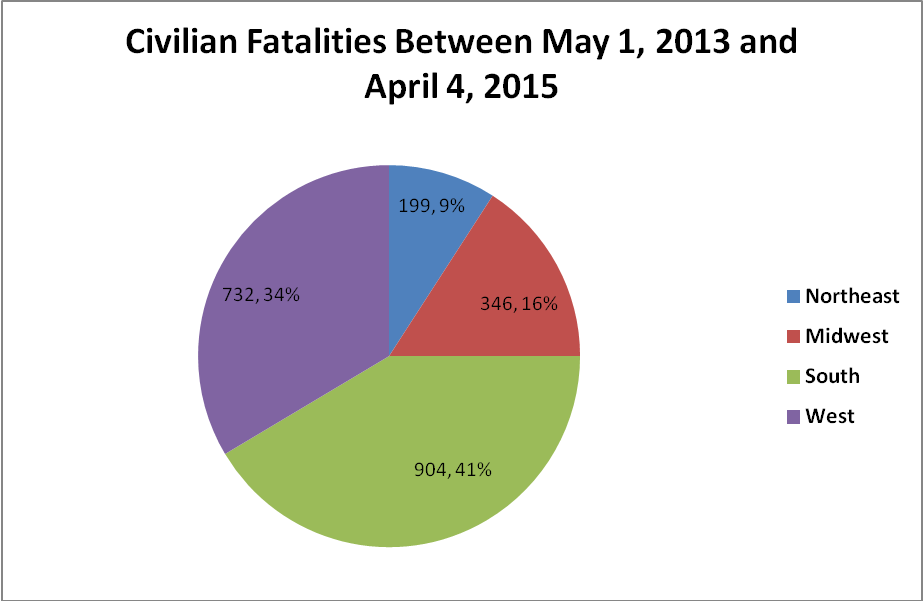
When the data was sorted by U.S. Census regions, 41.5% of all police action fatalities took place in the Southern states. Add California’s 730 incidents to the Southern total and the subsequent total account for 58.4% of all cases nationwide. In contrast, police action fatalities in the highly populated Northeast make up 9% of the total. (see pie chart) The large regional differences strongly suggest that these incidents are not the random acts of a few bad apples, as some suggest, but real differences in police training, policy and culture.
The states with the highest rate of police action fatalities, in descending order, are Alabama, Wisconsin, Washington State, Arizona, Oklahoma and New Mexico. Wyoming, Vermont and Idaho have the lowest rates. The states with the highest annual average of civilian fatalities are California (193), Texas (112), Florida (93), Arizona (50) and Illinois (33).
The data contained in the KilledByPolice Website is far more extensive since in contains reports of the police accounts and some follow-up articles, but this information is not yet in a form that allows for statistical analysis. It seems that most of the reports I reviewed so far involve police shootings, but this remains to be verified.
Defenders of law enforcement will say, with some justification, that the vast majority of police officers are honorable, law abiding and competent professionals who put their lives on the line to serve and protect the public. This is a true statement. As a whole the incidents of police action fatalities involves a tiny fraction of the overall mortality rate and it is sure to be a tiny fraction of all incidents of police engagement as well. This, however, is not a high standard to judge whether the current rate of fatal outcomes is significant. To help put these numbers a national context, there were only 70 civilians killed by the police in Great Britain in the last 90 years.
The better standard to judge the significance of this problem is to ask how many of these civilian casualties could we have avoided. Even when a police shooting is ruled a justifiable homicide, for example, different tactics and better training might still have avoided a fatal confrontation. The justifiable use of deadly force is predicated on existing policies, procedures, tactical training, departmental culture and the careful vetting of law enforcement personnel, to list just a few factors. It is our obligation police action casualties and protect the life and safety of every citizen, including those who are subject of police actions. The problem is very real and it deserves public attention.
