Home » Education
Category Archives: Education
Gov. Chris Christie’s “Fairness Formula” to Fund Public Education.
The following is my letter to the Star-Ledger Editor sent August 24, 2016. Governor Chris Christie has been pushing a plan to reduce the state’s educational funding to distressed school districts and increase funding to more affluent districts. He calls this his “Fairness Formula”. Each student in New Jersey would get the exact same amount of state aid, $6,599. The rest of the per/pupil cost, nearly $19,000 in this state, would have to come from local property taxes. Here is my response to his recent comments:
Dear Starledger Editor:
“The day of reckoning has come,” Gov. Christie says. He thinks it’s time that wasteful urban schools and poor districts pulled their own weight. He wants them to pay the full cost to educate their kids from property tax revenue. His one size fits all state aid plan will bring tax relief to wealthy (mostly Republican) suburbia. Here’s what he doesn’t say:
- · The 10 largest urban districts and 10 wealthiest school districts have virtually the same per pupil costs ($20.0k vs. $20.5k by my calculations)
- · The average median income in these 10 urban districts is around $45,000 vs. $159,000 in the wealthiest districts
- · More money is spent in urban districts on remediation to overcome the impact of poverty; while more money is spent in wealthy districts on advanced educational programs and high end sports
- · Property taxes are based on home values, which are 4.7 times higher in the wealthiest districts
- · Even with little state aid to offset costs, the average property tax rate in the wealthiest districts is 67% lower than in the largest urban districts
Instead of proposing a flat state aid rate per child Governor Christie should be proposing a flat property tax rate collected by each county and distributed according to need. As regressive as a flat tax is it would still be less regressive than what we have now.
Brian T Lynch, MSW
(for more detail on my analysis, go to:
| Rich School, Poor School and Distributive Justice in New Jersey |
No Fairness in Funding NJ Public Schools
by Brian T. Lynch, MSW
Fairness Formula? Governor Chris Christie is proposing a plan to give an equal amount of State Aid funding to every student in every school districts in New Jersey. Specifically, his proposal would take the higher amounts of State Aid we currently give to very poor districts and distribute it equally across the state to reduce property taxes in the wealthier suburbs. This, he says, is fair.
For those who are not familiar with New Jersey, most school funding is raised through a local wealth tax based on the assessed value of residential and private property. This is a highly regressive way to raise revenue, as you will see below.
We are big on home rule in New Jersey, so each town has its own independent school board. Each towns Board of Education proposes an annual school budget which is voted on in a public referendum. If passed, the costs are incorporated into the municipal budget and property tax rates are raised if more revenue is needed. If the school budget fails, town and school officials have to either cut the school budget or make other adjustments to municipal services so property taxes don’t rise.
Here is truism: Wealthy municipalities tend to grow more affluent over time while poor districts tend to decline even further.
Wealthy towns have better school systems in New Jersey. That is also a fact. So parents who can afford to upgrade their home often move into towns with better schools. Property values rise with the demand for homes in districts with better schools. Property values decline in districts that have underfunded or troubled schools, so property tax rates must increase in poor districts just to break even on current school spending. As property values increase in wealthy districts, more property tax revenue is generated. Some of this additional revenue goes into further improving the schools without the need to increase taxes. In some cases tax rates may even decline in affluent municipalities as home values rise. The result is that wealthy districts have much better public schools and lower tax rates while poor districts cannot afford to keep up the disadvantaged schools they have.
State Municipal and School Aid was designed to help level municipal tax burdens in New Jersey. State Aid is allocated to local municipalities and school districts to fill in the gaps that exist between wealthy and poor municipalities. This funding solution grew out of a state Supreme Court ruling, Abbott vs. Burke, that found New Jersey school funding did not result in equal education opportunity, as mandated by the State Constitution.
This vicious cycle of migration between rich and poor districts is a big reason for the educational funding disparity. It is the one usually mentioned by NJ state legislators and the press. But this cycle only exacerbates an underlying funding flaw. A wealth tax based on residential property values is incredibly regressive.
I wrote another article about the regressive education taxes in New Jersey last year. The Governor’s new School Aid plan only compounds the problem.
To show just how unfair residential wealth taxes are for funding public schools, consider that people who own million dollar homes almost always have significant other wealth investments and ownership interests that aren’t being taxed to funding public schools. The rich have far more wealth and investment income. On the other hand, people who own homes in economically depressed areas, people whose homes are well below the state average in value, have few investments or ownership stakes. Many of them have a negative net worth, almost no savings and many of them struggle to pay their monthly bills.
Most economists agree that a flat tax is a regressive tax. It favors the rich, but it is still far less regressive than the property tax scheme in New Jersey. To illustrate, the table below looks at information from three actual New Jersey municipalities: a poor district, an modestly affluent district and a wealthy district. The number of students in these districts tell you that these aren’t all K-12 districts, but the tax lesson here is still valid whether a district is a sending district or not.
| Table 1 |
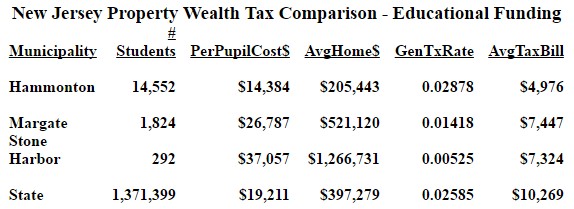
Hammonton and Margate are municipalities in Atlantic County and Stone Harbor is in Cape May County. In all three districts the average tax bill is below the state average. Hammonton does a pretty good job of keeping per pupil costs down so it’s residents can afford their property taxes. It is a town where the average home value of $205k is significantly below the state average of nearly $400k. It is not an affluent community like Margate, or a wealth district like Stone Harbor where the average home sells for over a million dollars.
The average tax bill in Hammonton is just under $5,000 per year, almost half the state average. The $14,384 annual per/pupil cost of education is also below the $19,211 state average. The low tax bill per resident is due, in part, to the fact that Hammonton receives $20 million dollars in State Aid.
Despite all of their frugal budgeting to keep tuition costs down, and despite a good amount of state assistance, look at Hammonton’s general property tax rate. It is double the tax rate in Margate and more than five time higher than the tax rate in Stone Harbor. Hammonton’s property tax rate is still well above the state average.
The residents of Margate and Stone Harbor pay a few thousand dollars more per year in property taxes, but they can well afford it. They pay less than the state average in property taxes yet spend far more than average in student tuition. Even so, Margate currently receives $2.5 million in State Aid while the very wealthy Stone Harbor receives nearly a half-million dollars in State Aid. Ironically, Under Governor Christie’s plan, each of these three districts would receive substantially more State Aid, but this would come at the expense of the very poor urban districts, the so call “Abbott” districts, where poverty levels are very high and property values are very low.
If instead of a flat State Aid rate for every student, Governor Christie proposed a flat property tax rate, and used additional revenue from wealth districts to fill funding gaps in poorer districts, how would that effect property taxes in these three communities?
Keeping in mind that a flat tax is still regressive, and that home values are not a good indicator of wealth ownership (it under represents the wealth of the wealthy) the table below shows what property taxes would look like if a flat property tax was implemented based on New Jersey’s average property tax rate.
Table 2

This exercise illustrates just how incredibly regressive the current property tax scheme is. More affluent towns are paying a lower property tax rate and middle class communities are paying a higher rate. Even a flat property tax rate would double Margate’s tax bill and more than quadruple Stone Harbors tax bill. A flat property tax rate would probably generate enough additional revenue to adequately fund and rehabilitate Abbott district schools and disadvantaged schools throughout the state. A progressive property tax formula would go even further to fully fund New Jersey’s public schools and give every child their constitutionally protected right to an equally good public education. Giving the same amount of state aid to both the rich and poor isn’t fair at all. A progressive wealth tax based on residential property values would be.
Below are the URL internet addresses for all of the data presented above.
_____________________________________________________________
http://www.nj.com/education/2015/04/nj_schools_how_much_is_your_district_spending_per.html
http://www.nj.gov/education/data/fact.htm
http://www.state.nj.us/education/data/enr/enr14/stat_doc.htm
http://www.state.nj.us/treasury/taxation/lpt/taxrate.shtml
http://www.state.nj.us/treasury/taxation/lpt/class2avgsales.shtml
http://www.joeshimkus.com/NJ-Tax-Rates.aspx
http://www.state.nj.us/dca/divisions/dlgs/resources/stateaidinfo.shtml
New Jersey’s Regressive Public School Funding
by Brian T. Lynch, MSW
New Jersey recently published the annual “Taxpayers Guide to Educational Spending”. The headline in the Star Ledger was that school spending is up 5% over last year. This is hardly news given that inflation alone accounted for 1.7% of the increase.
Much of the remaining 3.3% increase in school spending is structural by design. Consider that new teacher salaries start low and increase annually as they gain experience. We also compensate teachers as they obtain higher educational degrees as a means of improving the quality of our teachers. Add to this the fact that the total number of teachers gradually increase as student enrolled numbers creep up a little every year. Then there is the higher than inflation increases in fuel costs that drive up the cost of student transportation each year. The retirement of higher paid teachers and administrators don’t quite balance out these other factors.
What irks the public most about this 5% increase is really the story behind how we fund public education in New Jersey. It just seems unfair. And when you look under the hood, it really is unfair. Wealth based public school funding is regressive in nature. It favors the wealthy and disfavors the poor. What it costs to educate a child doesn’t vary that much between wealthy and poor school districts, but the value of property and therefore the tax base varies a lot. In today’s economy especially, the prosperity in wealthy school districts is growing rapidly relative to per pupil costs while property values in less prosperous school districts are in decline.

To understand the disparity of wealth based public education funding, let’s take affluent Morris County as an example (located in the central most area of the Northern half of the State). Morris County has many wealthy school districts, such as Harding where the average home sells for over a million dollars. It also has districts like Wharton where the average home sells for a quarter of that amount, or about $251,000. Property values in Dover are a bit higher, but the median family income in the Dover school district is just $59,000 compared with $160,000 per year in Mountain Lakes. (Fig.1 below)
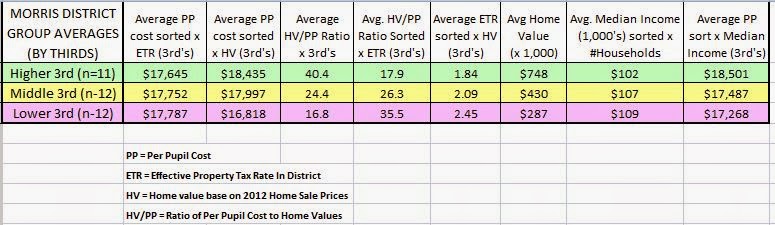
One way to gain some perspective on property based school funding is to compare what it costs to educate a student with what it costs to buy a home in the same district. In the eleven wealthiest districts of Morris County, home prices are 30 to 50 times more than the educational cost per pupil. Home values are just 16 to 18 times more than per pupil costs in the 12 poorest districts. As a general rule, the higher a district’s property values, the lower the tax rates. The reverse is usually true in poorer districts. Districts with lower property values, and lower income levels, generally have higher tax rates. While the 11 wealthiest districts in Morris County pay a little more to educate children in their district, their property tax rates are about one-third less than in the 12 poorest districts. (Fig. 2 below)
The dramatic contrast between home values and per pupil costs is partially masked when just comparing tax rates because, in the suburbs, wealthier districts tend to have fewer households. Fewer household to share the tax burden mean higher tax rates to generate sufficient revenue. Despite this fact, tax rates in 8 or the 11 richest districts is among the lowest in Morris County. Only three of these wealthy districts have higher per pupil costs while three have among the lowest per pupil costs. This highlights the fact that education costs are similar across the county. The average district cost per pupil is $17,730, plus or minus $2,038. There are a few outliers in either direction.
Educational costs vary far less than home values from district to district, so families in wealthier districts have a far easier time affording public education than families at the lower end of the economic ladder. While New Jersey’s State School Aid formula is supposed to help balance school funding across all districts, it does little to correct the underlying inequality and unfairness of wealth based educational funding.
Sources
Taxpayers’ Guide to Educational Spending 2013: http://www.state.nj.us/education/guide/2013/
General Tax Rates : http://www.state.nj.us/treasury/taxation/pdf/lpt/gtr13mor.pdf
Average Home Sales : NJ Spotlight News @ http://www.njspotlight.com/stories/13/02/28/average-home-sales-prices/ For March 1, 2013
Median Income and # Households: http://www.njspotlight.com/stories/13/12/19/median-income/
Figure 1
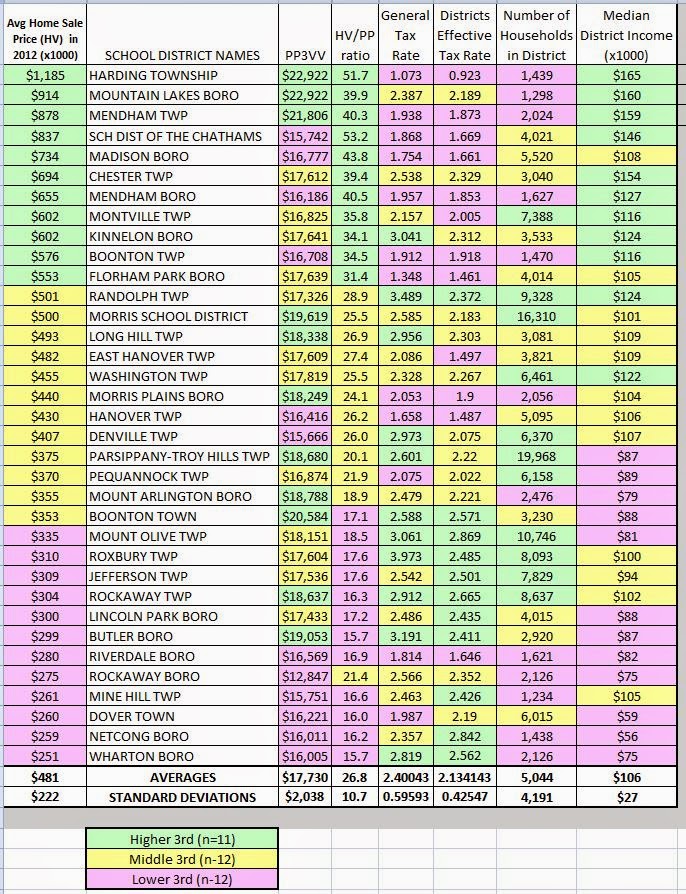
Figure 2
Are Banks Banking On Student Debt?
by Brian T. Lynch, MSW
College graduates have always earned more in their lifetime than non-college graduates, but higher tuition costs is increasing borrowing and the higher interest rates on these loans is taking a bit out of their future. In addition, there continues to exist a higher unemployment rate for college graduates.
The Federal Reserve Bank of New York just released its quarterly Household Debt report. It reveals that non-housing debt is rising and student loans are a big contributor. Non-housing debt increased 2.8% since last quarter and 4.9% from a year ago. Housing debt decreased 1.9% from a year ago.
Looking at just the non-housing debt, student loans account for 36% of the total, up a percent from a year ago. Auto loan debt is increasing faster over the last year and now accounts for 30% of all non-housing debt. Student loan debt rose 4% from the last quarter and 7.29% from a year ago. Meanwhile credit card debt is unchanged over the past 12 months while other forms of non-housing debt declined by over 3%.
The Federal Reserve also reported good news that 90-day delinquency rates on household debt has declined. For the banking industry it is a twin blessing when borrowing rises and delinquency falls. For consumers it is a mixed blessing, at best. But, when you look at the particular, it is immediately clear that college educated adults are in serious trouble. They are defaulting as never before. Look at the line graph below and you will see what I mean. The student loan default is the red line that starts as the third highest default rate in 2004 to exceed credit card and auto loan defaults as of last year.

Source: Fed Report http://www.newyorkfed.org/regional/householdcredit.html
According to the Fed report, outstanding student loan balances increased to $1.027 trillion as of September 30, 2013, a $33 billion increase from the second quarter. The 90+ day delinquency rate increased, and is now at 11.8%.
Full Report: http://www.newyorkfed.org/research/national_economy/householdcredit/DistrictReport_Q32013.pdf
Higher tuition costs means greater borrowing which results in higher monthly payments on the debt. The high rate of unemployed, or underemployed college graduates is part of the reason for the higher default rates. What follows is a snippet from an excellent article in the Atlantic Monthly. (Go there to read it in full)
How Bad Is the Job Market For College Grads? Your Definitive Guide
JORDAN WEISSMANN APR 4 2013
They’re Better Off Than High School Grads … Bachelor’s holders (in blue below) have about half the unemployment rate of high school graduates (in red below). BA’s are still suffering from double the low rate of joblessness they enjoyed pre-recession. And yes, they’re even worse off than they were during the tepid economies of the early nineties or pre-housing bubble oughts. But on the whole, you’d much rather have a degree in this job market than not.

But They’re Still Hurting… That’s all bachelor’s holders, though (or at least the ones over 25, who the Bureau of Labor Statistics routinely tracks). So what about young adults just off campus? The numbers aren’t a nightmare, but they aren’t especially pleasant either. Last month, the Bureau released a special report looking at Americans under 30 who’d earned a bachelor’s in the past year, as of October of 2011. About 73 percent were employed (the paper didn’t specify between full time and part-time). More than 11 percent were still looking for work.

In addition to the higher rate of unemployment, rising tuition costs over the past decade has meant larger monthly payments. College tuition costs have even risen faster than medical costs, and much faster than the consumer price index. Below is a very clear graphic depiction of this from Professor Mark J. Perry out of the University of Michigan.
Professor Mark J. Perry’s Blog for Economics and Finance
The chart above illustrates graphically the “higher education bubble” by comparing the annual increases in the CPI for “College tuition and fees” (7.45% per year since 1978) to annual increases in the CPI for “medical care” (5.8% per year since 1978) to annual increases in the median price for new homes (4.3% per year) to the annual increases in the “CPI for all items” (3.8% per year) 
[See more at: http://mjperry.blogspot.com/2011/07/higher-education-bubble-college-tuition.html#sthash.HF1DSyOu.dpuf ]
The good news, according to the Trends in Education Website, is that the rate of tuition increases is declining. Here below is a snippet from their Website.
Average Rates of Growth of Published Charges by Decade
The 2.9% one-year increase in average published tuition and fees for in-state students at public four-year institutions in 2013-14 was 0.9% after adjusting for inflation. This relatively small increase in prices means that despite very large annual increases earlier in the decade, tuition inflation between 2003-04 and 2013-14 was similar to that between 1983-84 and 1993-94.
Figure 4: Average Annual Percentage Increases in Inflation-Adjusted Published Prices by Decade, 1983-84 to 2013-14
See Key Points|See Also Important
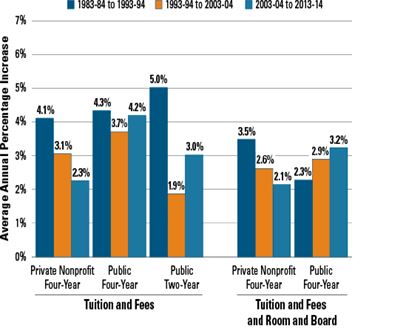
Each bar in Figure 4 shows the average annual rate of growth of published prices in inflation-adjusted dollars over a 10-year period. For example, from 2003-04 to 2013-14, average published tuition and fees at private nonprofit four-year colleges rose by an average of 2.3% per year beyond increases in the Consumer Price Index.
A third reason why so many college students are unable to pay their loans is the rising cost of financing those loans. Karen Weise recently wrote a an article in Business Week that laid out the problem of higher student loan rates. A snippet appears below.
Why Your Student Loan Interest Rate Is So High
By Karen Weise April 04, 2013
Business Week
Joe Szczepaniak pays a 3.5 percent interest rate on the mortgage for his house in a Chicago suburb. His car loan is 1.79 percent. The federal education loans he took out to send his four sons to college? They’re all above 7 percent. “Student loans have been the big black holes of my budget,” he says. Szczepaniak, who calls himself “Mr. Quicken” because he carefully tracks his finances, questions why the $200,000-plus he owes on the student loans doesn’t “reflect reality” and today’s low rates.
The answer is that Congress, not the market, sets rates for federal loans—which account for 85 percent of the roughly $1 trillion in outstanding education debt—and refinancing to a lower rate is rarely an option. Now some lawmakers and private lenders are looking for ways to give education borrowers more repayment and refinancing options.
[Read more at http://www.businessweek.com/articles/2013-04-04/why-your-student-loan-interest-rate-is-so-high ]
Student loan rate had been set to double, so congress acted to mitigate the sudden increase that was to occur. There is good information on the Consumer Financial Protection Bureau Website detailing the recent changes. An update on government student loan interest rates was recently published (see below). At a time when I can get a car loan from my credit union with an interest rate below 3%, our college students can’t get a federally subsidized student loan for under 3.86%, and private bank loans for students is even higher.
Consumer Financial Protection Bureau
Updated on August 13, 2013:
Last week, the president signed legislation passed by Congress to adjust federal student loan interest rates for this academic year. Here’s what the new rates look like:

http://www.consumerfinance.gov/blog/changes-to-federal-student-loan-interest-rates/
We have to stop and ask ourselves what the long term impact will be on our children and our economy if we don’t do more to make college affordable.
GOP Doubles Down with Cynical Student Loan Bill
THE HOUSE HAS PASSED STUDENT LOAN SOLUTIONS, TIME FOR THE SENATE TO ACT
Posted by Nick Marcelli on June 18, 2013
Today, House Republican Leadership held a press conference to discuss the steps the House has taken to avoid the doubling of student loan rates on July 1. The House has already passed a solution to avoid the doubling of student loan rates that echoes the President’s own plan. It is time for the Senate to act.
BUT WAIT!
Take a closer look at what the GOP and Eric Cantor are touting as a positive step to help students pay for college.
Stafford Loan – Current fixed rate for this student loan is 3.4% and it is scheduled to double in July to 6.8%. The House GOP just passed the Smarter Solutions for Students Act (SSSA) which would end the fixed rate and calculate a variable rate at 2.5% points over the 10 year Treasury Bill rates, with a cap of 8.5% on Stafford Loans. The average 10 yr T bill rate so far this month is 2.66%, so the current Stafford Loan rate would be 5.16%.
While the 5.16% today is better than the 6.8% rate beginning in a few weeks, the variable rate cap of 8.5% is 1.7% higher than the fixed rate would be. So Congratulations to the House GOP for passing a plan that would both lower and raise student loan rates at the same time. If this isn’t cynical enough for you, add the SSSA’s current student loan rate of 5.16% today with the cap rate of 8.5% and then divide by two. This gives us the variable rates mid-range of 6.83%, nearly identical to the higher fixed rate as of July. So for bankers this is a revenue neutral proposal over a range of years while current college students get only a 52% rate increase as of July. For future college students the rate can more than double the current 3.4% fixed rate.
A look at the other provisions of the bill reveal similar findings. This could be a bill written by the student loan industry to squeeze more out of students without appearing to be quite as greedy.
Below is an analysis that (also cynically) does not assess the financial impact if the current 3.4% rate is allowed to stay the same.
H.R. 1911, Smarter Solutions for Students Act
cost estimate
may 20, 2013
read complete document (pdf, 28 kb)
As ordered reported by the House Committee on Education and the Workforce on May 16, 2013
H.R. 1911 would change the interest rates for all new federal loans to students and parents made on or after July 1, 2013, from a fixed interest rate set in statute to a variable interest rate, adjusted annually. Under the bill, interest rates for all new subsidized and unsubsidized student loans would be based on the interest rate on a 10-year Treasury note plus 2.5 percentage points, with a cap of 8.5 percent. (Borrowers pay no interest on subsidized loans while enrolled in school or during other deferment periods but are responsible for interest at all times on unsubsidized loans.) The interest rate for all new GradPLUS and parent loans would be based on the interest rate on a 10-year Treasury note plus 4.5 percentage points, with a cap of 10.5 percent. The bill also would eliminate the cap on the interest rate on all new consolidation loans (multiple loans for a single borrower combined into one loan) originated on or after July 1, 2013.
Under current law, all subsidized and unsubsidized loans originated on or after July 1, 2013, will have a fixed interest rate of 6.8 percent, and all GradPLUS and parent loans will have a fixed rate of 7.9 percent. In addition, the interest rate on all consolidation loans is capped at 8.25 percent.
CBO estimates that enacting H.R. 1911 would reduce direct spending by about $1.0 billion over the 2013-2018 period and by $3.7 billion over the 2013-2023 period. Enacting the bill would not affect revenues. Pay-as-you-go procedures apply because enacting the legislation would affect direct spending. Implementing the bill would not have a significant impact on spending subject to appropriation.
Ideological Barriers to High School Graduation For Every Child
Thanks to the efforts of the US Department of Education, high school graduation rates can be compared across state lines for the first time. The results of the 2010-11 Four-Year Regulatory Adjusted Cohort Graduation Rates report is revealing and a bit disturbing. The top high school graduation rate was in Iowa where 88% of all students graduated . The lowest was in Nevada where just 61% graduated. (What’s happening there?) The median of state averages for graduation rates was just 80%.
The nations high school graduation rates are disappointing, but when you break down the numbers they become truly disturbing. In almost every state, White children had the highest graduation rates. In most states the graduation rates for African American and Native American students fell 10 to 20 points below White students. A similar gap can be seen between White students and those who are economically disadvantaged. The largest race based gap was in Minnesota where 84% of White students graduate verses only 49% of Black students. That’s a 35 percentage point gap. The other states with large race based graduation gaps include Nevada (28 pts.), Wisconsin (27 pts.) and Ohio (26 pts.). These are not the states we tend to think of when we talk about the racial divide.
But the biggest and most disturbing graduation gaps are not along racial, ethnic or even economic lines. They occur in two unexpected categories, children with disabilities and children for whom English is their second language.
In Mississippi and Nevada only 23% of disabled students graduated high school. These are children who, through no fault of their own, require every advantage they can get if they are to lead happy, productive lives. In Nevada the graduation gap between students with disabilities and White students was 48 percentage points. Mississippi did a much better job then Nevada overal . White students graduated at a respectable rate of 82%. The graduation gap for Mississippi’s disabled children, however, was 59 points lower. Contrast that with Arkansas where there was only a 9 point gap, or with South Dakota where there was just a 2 point difference between White students and disabled students. What is possible for disabled children in South Dakota should be possible in every state. Over all, the graduation gap between abled and disabled students is greater than ethnic, racial or economic factors. The biggest gaps were mostly in the South, but almost every state needs to do a better job.
The second disturbing category is the graduation gaps for immigrant children whose first language is not English. While states such as West Virginia, Maine, South Dakota and Arkansas were able to graduate English-language learners on par with White students, most other states were less successful. The graduation gaps in Georgia (44 pts.), Nevada, Alabama (both 42 pts.) and New York (40 pts.) were among the biggest. But it is Arizona, by far, that had the largest gap in the graduation rates between White students (85%) and those who needed to learn English (23%). This was a 60 percentage point drop in graduation rates for English-language learners in Arizona, and the reason for this poor performance has a lot to do with ideological politics. Voters in Arizona eliminated bilingual education in a 2000 ballot measure. Proposition 203 was a popular backlash against bilingual education in favor of a more nationalistic “English for the Children Philosophy”. Bilingual education was viewed as a politically correct relic of our liberal past.
It is unconscionable to hold children in the cross-fire of America’s ideological wars. Children are a special class of citizens who rightfully have special protections and certain undeniable rights, including the right to equal educational opportunities. To set different standards based on race, religion, disabilities or place of origin is unacceptable. To eliminate educational opportunities or to choose educational programs based on politics over empirical practice is malfeasance. It harms children and ultimately harms our society. There is no excuse for not duplicating the success many other state already have in educating children of color, children with disabilities and children who speak another language. State sovereignty be damned. Children everywhere are every citizens concern. We must do all we can to remove politics from public schooling and press the case for competent practices that gives every child a fair shot at success. High School Graduation for every child should be our national goal.
(Below are excerpts from an article detailing the struggle to improve educational outcome for English-language learning students in Arizona.)
Bilingual Education vs. English Immersion
http://cqresearcherblog.blogspot.com/2009/12/bilingual-education-vs-english.html
Excerpts:
… Spanish-speaking [families in] Nogales [Arizona]… in 1992 [filed] a federal suit aimed at improving educational opportunities for non-English-speaking students in the overwhelmingly Hispanic town. The class action suit claimed the school district was failing to comply with a federal law – the Equal Educational Opportunities Act of 1974 – which requires each state to take “appropriate action” to ensure that English-language learners (ELLs) enjoy “equal participation in its instructional programs.”
… The plaintiffs won a pivotal decision in 2001 requiring Arizona to boost funding for English-language learning in Nogales and the rest of the state. In a narrowly divided decision in June, however, the Supreme Court gave state officials an opportunity to set aside the lower court ruling.
Writing for the 5-4 majority, Justice Samuel A. Alito Jr. said the federal district judge had failed to adequately consider changed circumstances since 2001. Among other changes, Alito cited the state’s decision to drop bilingual education in favor of so-called “sheltered English immersion” as the officially prescribed method of instruction for students with limited English proficiency.
Arizona’s voters had decisively rejected bilingual education in a 2000 ballot measure. Along with similar measures passed in California in 1998 and Massachusetts in 2002, Arizona’s Proposition 203 embodied a popular backlash against bilingual education that had grown since the 1980s. Critics of bilingual teaching viewed it as a politically correct relic of the 1960s and ‘70s that had proven academically ineffective and politically divisive. [snip]
… The debate between English-only instruction and bilingual education has been fierce for decades. “People get very hot under the collar,” says Christine Rossell, a professor of political science at Boston University and critic of bilingual education. [snip]
… Those who support a bilingual approach, says Arizona Superintendent of Instruction Thomas Horne, “aren’t interested in teaching the kids English,” but want to maintain “a separatist nationalism that they can take advantage of.” Horne, a Republican, intervened with the state’s GOP legislative leaders to try to undo the federal court injunction. [Snip]
… “It’s a growing challenge,” says Patte Barth, director of the Center for Public Education at the National School Boards Association (NSBA). “We have many more children coming into our schools for whom their first language is not English… Voluminous, statistics-heavy studies are cited by opposing advocacy groups as evidence to support their respective positions on the bilingual versus English-only debate. But Barth says language politics, not research, often determines school districts’ choice of instructional method. “A lot of it is political,” she says. “A lot of decisions about language instruction aren’t really informed by the research about what works for children.”
High School Graduation Rates A National Shame
Educational achievement is a long range predictor of a nations economic health and well being. In advanced economies, a great deal depends on scientific and technical achievements which begin with educational excellence.
Summary of Finding
Children with limited English proficiency also graduate at lower rates in most states, but especially in Nevada (29%) and Arizona (25%). Students with limited English proficiency actually have a better graduation rate in West Virginia (79%) than do White children for whom English is their primary language (77%). In states as diverse as Arkansas and Maine limited English proficiency is hardly a barrier at all. Nineteen states have high school graduation rates of less than 50% for children for whom English is not their primary language.
How Public Schools Came to Be and the Fight to Dismantle Them
Publicly funded local schools are a universally accepted social norm. Abandoning them would be almost unthinkable. When we stop to consider what we value in our communities, local public schools are almost always a top consideration and a source of civic pride.
This isn’t just true in the United States. Publicly funded education has become a global norm in all advanced societies for nearly century. But a hundred years isn’t very long in the sweeping arch of history, is it? Public schooling has fundamentally altered American society, yet few of us can recount how this radical change came about. How did public schools come to be?
The fight to establish public schools is almost lost history. There is very little content or comment about it on the Web or in our public media. What we do hear lately are a great many lively debates about burdensome public school taxes, failing schools, voucher programs, charter schools, and making public funds more available for private schools and colleges. Lost to our comprehension in these debates is how these arguments follow the exact fault lines in what was an incredibly contentious battle, waged over the course of a generation, to establish public schooling. The political struggle for public education has been compared as second only to the fight for the abolition of slavery in its intensity and divisiveness, but who remembers any of that today?
The battle to undo public education is already underway. If we fail to grasp the fact it is because we have no historical context to recognize the attacks for what they are. If we hope to retain and strengthen our system of public education in America, we need to place the current arguments against it in historical context. We need to reclaim our history.
To this purpose I recommend a book copyrighted in 1919 by Ellwood P. Chubberly entitled, “Public Education in the United States, A Study and Interpretation of American Educational History.” It is a text book, long out of print, but the entire book can be downloaded or read on line. Much of the book is obviously dated, but the early chapters on the history of public education provide the valuable context we need to understand the political arguments today.
Of particular interest to our purpose here is Chapter V., “TheThe Battle for Free State Schools”, beginning on page 118. Read this chapter first for some quick insights. Below is the full URL addresses and links to the book and its Table of Contents.
Full URL Addresses:
Book
Table of Content
High School Graduation Rates A National Disgrace
Educational achievement can be viewed as a long range predictor of a nations economic health and well being. In advanced economies, a great deal depends on scientific and technical advantages.
A recent report from the World Economic Forum published a study on global business competitiveness that ranks 144 nations according to indicators in 12 categories. While the United State ranked 7th in the world over all, our ranking in primary and secondary education measures were alarming. The united states ranked 58th on primary school enrollments and 38th on the quality of our primary education. We ranked 47th in secondary school enrollment and 47th on the quality of math and science education. (See report summary here )
Now the U.S. Department of Education has released data detailing state four-year high school graduation rates in 2010-11 – the first year for which all states used a common, rigorous measure. The report states:
“The varying methods formerly used by states to report graduation rates made comparisons between states unreliable, while the new, common metric can be used by states, districts and schools to promote greater accountability and to develop strategies that will reduce dropout rates and increase graduation rates in schools nationwide.
The new, uniform rate calculation is not comparable in absolute terms to previously reported rates. Therefore, while 26 states reported lower graduation rates and 24 states reported unchanged or increased rates under the new metric, these changes should not be viewed as measures of progress but rather as a more accurate snapshot. “
See States Four Year Graduation Rates here: http://www2.ed.gov/documents/press-releases/state-2010-11-graduation-rate-data.pdf In reading the summary below please keep in mind that no data was available from Idaho, Kentucky, Oklahoma or Puerto Rico and some other states had data missing.
Summary of Finding
The highest graduation rate achieved by any state is in Iowa, which as an 88% high school graduation rate. Wisconsin and Vermont were right behind Iowa with an 87% graduation rate. The lowest high school graduation rate is just 59% in the District of Colombia. Among the sovereign states the lowest graduation rates were in Nevada (62%), New Mexico (63%), Georgia (67%), Alaska and Oregon (both at 68%). All together, 13 states have high school graduation rates at or below 75%.
When it comes to race and ethnicity, the graduation rates for Latino children in Maine and Hawaii are slightly better then for White students. Beyond these two examples, in every other state the rates are lower for both Black and Latino students, and significantly so in some states. In Minnesota and Nevada Black student have a graduation rate below 50%. The disparity in Minnesota is stark. White students in Minnesota graduate at a rate of 84% while the Latino graduation rate is 51% and only 49% of Black students graduate. These numbers and other dramatic disparities among the states are a national disgrace.
Even more startling is the low graduation rates and huge rate disparity for children with disabilities. Graduation rates for these children range from a high of 77% in Texas, 75% in Arkansas and 73% in both Kansas and New Jersey to a low of 23% in Mississippi and Nevada. Only 33 states have graduation rates above 50% among children with disabilities. Children with disabilities are not more severely handicapped in places like Louisiana (29%) than Pennsylvania (71%).
Children with limited English proficiency also graduate at lower rates in most states, but especially in Nevada (29%) and Arizona (25%). Students with limited English proficiency actually have a better graduation rate in West Virginia (79%) than do White children for whom English is their primary language (77%). In states as diverse as Arkansas and Maine limited English proficiency is hardly a barrier at all. Nineteen states have high school graduation rates of less than 50% for children for whom English is not their primary language.
I would appear that childhood disabilities and limited English proficiency are not that closely correlated with economic disadvantage. There are no states in which the graduation rate for economically disadvantaged children falls below 50%. In Arizona, for example, economically disadvantaged students have a 73% graduation rate and students with disabilities have a 67% rate of graduation while, as mentioned, students for whom need help learning English have a very low graduation rate (25%). In the case of Mississippi economically disadvantaged students graduate at a rate of 69% while only 23% of disabled children graduate high school.
So what’s going on here? From the broad strokes of this report it would seem that poor educational outcomes are less a result of funding or the demographics of being economically poor and more a matter of selective neglect for some student populations. I this judgment is too harsh. However, no matter how you look at this data, United States appears heading for national decline if we remain unable to turn around these educational outcomes.
