Home » Employment
Category Archives: Employment
Illegal Immigrant Wages and Impact in New Jersey
by Brian T. Lynch, MSW
I decided I can only respond to certain critics of my blog by breaking down their comments into smaller, more manageable chunks . And then I can only answer their questions that have actual, verifiable answers. Here is a small portion of one of my most recent critics comments from a blog post of mine entitled “America at the Crossroad of Crisis.” His comment reads in part:
“The idea that migrants and even those who are here illegally are not taking away the jobs of “Americans” is superficial bull at best. When labor unions price the services of union members to a point that few can afford such labor then will that not create job opportunities for those willing to work for far less? What is the hourly wage for a carpenter in your state or general locality? What is the rate for an electrician or a plumber?”
First, a clarifying anecdote
A few years back I hired a middle aged factory worker named Tony to mow my lawn. I mowed my lawn for many years but suffer allergic reactions every time. I finally got smart.
Tony has a part-time lawn service to supplement his factory salary. He hires kids to help him in the summer. He told me that he paid the last young man $12.00/hr to weed-wack and leaf blow. Several weeks into the summer his helper quit to take a part-time job flipping burgers for $7.25 per hours. The kid said landscaping work was too much work.
If you read my blog or articles you know that I am very concerned about the fact the US wages have been suppressed by big business for nearly 40 years.
The US median household income for a family of four is currently about $52,000 per year. Cost of living varies state by state and New Jersey have among the highest. It is also among the wealthiest states. The median income for a family of four in New Jersey is $71,637 per year.
Carpenters
The annual average wage for all carpenters (union or otherwise) is $37,000 per year in New Jersey. Annual carpenter wages range from a low of $28,000 to a high of $66,000 per year.
This means that even union carpenters in New Jersey straddle the US median family income, and all carpenters make below the state median income. Nearly half of all the New Jersey carpenters with a family are not financially independent. Either their spouse must work , or they must moonlight to make ends meet. On their own fulltime wages, many single income carpenters in New Jersey qualify for some form of taxpayer subsidy such as daycare assistance or housing assistance.
Electricians
The annual average wage for all electricians (union or otherwise) in New Jersey is $45,000 per year. Annual electricians wages range from a low of $16,000 to a high of $111,000 per year.
Most electricians are better off in New Jersey than are carpenters or plumbers. Even so, the average electrician in New Jersey makes less than the US median income and far less than the New Jersey median income. On their own fulltime wages alone, some single income electricians in New Jersey still qualify for some form of taxpayer subsidy such as daycare assistance or housing assistance.
Plumbers
The annual average wage for all plumbers (union or otherwise) in New Jersey is $26,000 per year. Annual plumber wages range from a low of $22,000 to a high of $102,000 per year.
Notice how close to the average plumber wages the low end of plumber wages are? That means most plumbers are making close to the lower end of the range in New Jersey. Plumbers do worse economically than carpenters or electricians. Most make far less than the US median wage and only about a third of the New Jersey median salary. On their fulltime wages alone, most single income plumbers in New Jersey qualify for some form of taxpayer subsidy such as daycare assistance or housing assistance.
Immigrant Annual Wages
It isn’t easy to find solid data on the annual incomes of undocumented immigrants, but there are many independent studies and scholarly works that found undocumented immigrants are not taking away our jobs or costing us taxpayer money (references upon request). Even the very conservative US Chamber of Commerce agrees.
It is estimated that undocumented farm workers in the US make between $10,000 and $12,000 per year. The authors of that analysis also noted that, unlike most workers, wages for an undocumented worker almost never rise over time. This fact agrees with my own experiences. I have many acquaintances who are undocumented aliens. They live in the shadows, don’t complain and don’t get raises. It is almost certain that undocumented aliens makes less than $23,000 per year, and probably much less.
Another study in Chicago found that the average wage of undocumented aliens in that city was $7.00 per hour, which is $1.00 below that states minimum wage. I haven’t found a similar study for New Jersey’s undocumented aliens yet, but suspect their average wage is at or near the minimum wage as well. Note that minimum wage in New Jersey is the federal minimum wage rate of $7.25 per hours. A person working 40 hours per week for 52 weeks would make just over $15,000 per year.
New Jersey has the fifth largest number of undocumented aliens in the county. Many work at minimum wage and many also work below minimum wage. Almost all work more than 40 hours per week, so their annual family incomes are not directly comparable to the annual family incomes of others who work more traditional hours. Also, the number of employable adults in immigrant household are often more than in traditional families. For these reasons, the household incomes of undocumented aliens is a skewed measure. What immigrants lack in wage rates they make up for in the number of hours the spend work.
Given the huge wage rate disparity between undocumented immigrants wages and the wages of even the lowest paid, non-union plumbers, none of whom work for minimum wage, it seem unlikely that foreign born workers are taking away many US jobs. It is my experience, living next to a town that is 75% Latino, that most undocumented immigrants have jobs that no one else born here wants for wages that most Americans would never accept. As a result of their discounted labor we enjoy discounted farm produce, discounted nursing home care, discounted restaurant meals, etc.
Immigrants in New Jersey
Immigrants and their children are growing shares of New Jersey’s population and electorate.
(Source: https://www.americanimmigrationcouncil.org/research/new-americans-new-jersey)
· The foreign-born share of New Jersey’s population rose from 12.5% in 1990, to 17.5% in 2000, to 21.6% in 2013, according to the U.S. Census Bureau. New Jersey was home to 1.9 million immigrants in 2013, which is more than the population of the entire state of Nebraska.
· 53% of immigrants (or over 1 million people) in New Jersey were naturalized U.S. citizens in2013 —meaning that they are eligible to vote.
Immigrants Economic Impact on New Jersey
- Unauthorized immigrants comprised 5.8% of the state’s population (or 525,000 people) in2012, according to a report by the Pew Hispanic Center
- The 2014 purchasing power of New Jersey’s Latinos totaled $46 billion—an increase of 415% since 1990. Asian buying power totaled $46.3 billion—an increase of 727% since 1990, according to the Selig Center for Economic Growth at the University of Georgia.
- Immigration boosts housing values in communities. From 2000 to 2010, according to the Americas Society/Council of the Americas, the value added by immigration to the price of the average home was $3,730 in Bergen County; $6,121 in Middlesex County; $1,875 in Essex County; $2,050 in Monmouth County; $2,096 in Hudson County, $2,509 in Union County, and $1,896 in Camden County.
- New Jersey’s 67,755 Asian-owned businesses had sales and receipts of $29.9 billion and employed 115,024 people in 2007, the last year for which data is available. The state’s 68,374 Latino-owned businesses had sales and receipts of $10.2 billion and employed 48,059 people in 2007, according to the U.S. Census Bureau’s Survey of Business Owners.
- From 2006 to 2010, there were 101,251 new immigrant business owners in New Jersey, and they had total net business income of $6.2 billion, which makes up 22.4% of all net business income in the state, according to Robert Fairlie of the University of California, Santa Cruz.
- In 2010, 28% of all business owners in New Jersey were foreign-born, according to the Fiscal Policy Institute. In 2013,35.3% of business owners in the New York-Northern New Jersey-Long Island metropolitan area were foreign-born, according to the Fiscal Policy Institute and Americas Society/Council of the Americas. Furthermore, 49% of “Main Street” business owners—owners of businesses in the retail, accommodation and food services, and neighborhood services sectors—in the New York-Northern New Jersey metro area were foreign-born in 2013.
The other point here is this, it is much easy to make credible sounding claims on the internet disparaging other demographic groups of people than it is to research and debunk such claims. The person to whom I am responding will never accept the information I provided here for them to consider, but others who read this might be less inclined to believe everything anyone says about “illegal” immigrants in the future. (I hope)
Should Living Wage Minimums be Based on Individuals or Families?
by Brian T. Lynch, MSW

Question: In looking at the Living Wage calculator, I see that $10.83 for a single adult in Morris County, New Jersey where I live. This seems fair to me for a single person, but when you add one child to that scenario the rate jumps to $22.12 per hour. This raises a serious question. Does the Living Wage Movement suggest that wages should be adjusted according to need? [ http://livingwage.mit.edu/ ]
Answer: That’s a great question. I am not a spokesman for, or advocate of, the living wage movement as an organization. I do believe that living wages should be the minimum wage in this country. Minimum living wages should be what we pay summer college help or student interns, not full-time employees. It might also be appropriate for part-time seasonal help. It shouldn’t be what we pay permanently hired employees.
To answer your question, I researched what a living wage is in the 130 cities that have living wage laws. It turns out that their wage base is for a single employee, not including any dependents. A living wage in Manchester CT equals $15.54/hour (the highest) while it is $8.50 in Orlando FL (the lowest). It would appear that the Living Wage Movement is looking to index a minimum living wage minimum to local economies based on one adult with no dependents.
That said, the minimum wage in 1986 was $10.86/hour as opposed to its current level of $7.25/hour. If it had been indexed to inflation in 1986 the current minimum wage today would be $23.59/hour today. That clearly was intended to provide for a worker with a family. The current median family size is 2.54 persons per household. That inflation adjusted wage equals about $47,000 per year while the current median family wage is a little over $51,000 per year (and still declining, I might add).
Here’s the thing, we have only been talking about wage adjustments to keep pace with inflation. We have not been talking about raising wages to reward workers for our growing productivity. We have not been talking about sharing the wealth that workers help create so everyone keeps pace with America’s growing economy. Cost of living adjustment are important, but they shouldn’t be confused with a productivity, or merit raise.
America is $1.7 trillion richer today than it was in 1976. Our economy has doubled, yet the share of all that new wealth created by American workers in this same period of time is insignificant.
In the 1960’s my father was an appliance repairman at Sears. His salary was enough that my mother could stay home to raise my sister and me. Her role as mother to the next generation of citizens was valued. Today, a typical family of four making about $51,000 does so because both parents work. And they are only able to make ends meet because of easy access to credit to shift their financial burdens onto their future earnings.
When I speak about a living wage I am thinking about getting back to a point where one breadwinner can hold one full-time job and still raise a small family without needing government assistance to do it. That’s what we had, and that should be our goal as a country.
Minimum Wage is a Moral Question
by Brian T. Lynch, MSW
The White House put out a brief video on why we should raise the minimum wage to $10.10/hour. It is OK as far it goes, but it is still a little disappointing to me.

Click here to see the video. [ https://www.youtube.com/watch?v=PqtLQgkcUFM ]
Even the White House is looking at minimum wage law though the modern day pro-business bias that has infected all of civil government. Even though raising bottom wages creates an economic stimulus that would boost spending, increase demand for goods and services and create more jobs, this isn’t the most important aspect. The main reason to raise minimum wages is because it’s simply the right thing to do.
The question of minimum wage is actually a moral question. There is no good rationale for paying a full-time employee less than a self-sufficient wage. What is almost half of a human beings waking moments worth? What is the minimum compensation they should receive for devoting that time to enrich their employers? Why should it be less than what is required to survive with human dignity?
From a social perspective, should profitable businesses be held in high esteem as models of efficiency for paying wages so low that full-time employees require taxpayer subsidy to keep from becoming homeless or having their children taken away from them? Should we have to subsidize the labor force of wealthy corporations like Walmart? Should the federal income taxes of those who make more than minimum wage have to be used to supplement the other employees who takes out the trash at night or mow the lawn? Why should any healthy corporation be allowed to boost their profits at public expense through subsidized labor?
If small businesses or start-up company need government subsidies or tax breaks to help pay their help, let these business owners apply for government assistance rather than make their employees feel inadequate by having to beg for government assistance. No man or woman who works hard all day long should have to apply for housing assistance or SNAP or KidCare or childcare assistance or HEAP or any other government subsidy. Let the business owners apply for government aid to help pay employees the self-sufficient wages all full-time workers should have. Let the means testing process for government subsidy programs fall to the employers. Let’s get it off the backs of the working poor and eliminate the social stigma they don’t deserve. Let the minimum cost of self-sufficient labor wages be part of the cost of doing business in America.
Profits for CEO’s and share holders should not come before self-sufficient wages for laborers. Exploiting workers and taxpayers to boost profits for investors and chief executives is immoral.
Are Banks Banking On Student Debt?
by Brian T. Lynch, MSW
College graduates have always earned more in their lifetime than non-college graduates, but higher tuition costs is increasing borrowing and the higher interest rates on these loans is taking a bit out of their future. In addition, there continues to exist a higher unemployment rate for college graduates.
The Federal Reserve Bank of New York just released its quarterly Household Debt report. It reveals that non-housing debt is rising and student loans are a big contributor. Non-housing debt increased 2.8% since last quarter and 4.9% from a year ago. Housing debt decreased 1.9% from a year ago.
Looking at just the non-housing debt, student loans account for 36% of the total, up a percent from a year ago. Auto loan debt is increasing faster over the last year and now accounts for 30% of all non-housing debt. Student loan debt rose 4% from the last quarter and 7.29% from a year ago. Meanwhile credit card debt is unchanged over the past 12 months while other forms of non-housing debt declined by over 3%.
The Federal Reserve also reported good news that 90-day delinquency rates on household debt has declined. For the banking industry it is a twin blessing when borrowing rises and delinquency falls. For consumers it is a mixed blessing, at best. But, when you look at the particular, it is immediately clear that college educated adults are in serious trouble. They are defaulting as never before. Look at the line graph below and you will see what I mean. The student loan default is the red line that starts as the third highest default rate in 2004 to exceed credit card and auto loan defaults as of last year.

Source: Fed Report http://www.newyorkfed.org/regional/householdcredit.html
According to the Fed report, outstanding student loan balances increased to $1.027 trillion as of September 30, 2013, a $33 billion increase from the second quarter. The 90+ day delinquency rate increased, and is now at 11.8%.
Full Report: http://www.newyorkfed.org/research/national_economy/householdcredit/DistrictReport_Q32013.pdf
Higher tuition costs means greater borrowing which results in higher monthly payments on the debt. The high rate of unemployed, or underemployed college graduates is part of the reason for the higher default rates. What follows is a snippet from an excellent article in the Atlantic Monthly. (Go there to read it in full)
How Bad Is the Job Market For College Grads? Your Definitive Guide
JORDAN WEISSMANN APR 4 2013
They’re Better Off Than High School Grads … Bachelor’s holders (in blue below) have about half the unemployment rate of high school graduates (in red below). BA’s are still suffering from double the low rate of joblessness they enjoyed pre-recession. And yes, they’re even worse off than they were during the tepid economies of the early nineties or pre-housing bubble oughts. But on the whole, you’d much rather have a degree in this job market than not.

But They’re Still Hurting… That’s all bachelor’s holders, though (or at least the ones over 25, who the Bureau of Labor Statistics routinely tracks). So what about young adults just off campus? The numbers aren’t a nightmare, but they aren’t especially pleasant either. Last month, the Bureau released a special report looking at Americans under 30 who’d earned a bachelor’s in the past year, as of October of 2011. About 73 percent were employed (the paper didn’t specify between full time and part-time). More than 11 percent were still looking for work.

In addition to the higher rate of unemployment, rising tuition costs over the past decade has meant larger monthly payments. College tuition costs have even risen faster than medical costs, and much faster than the consumer price index. Below is a very clear graphic depiction of this from Professor Mark J. Perry out of the University of Michigan.
Professor Mark J. Perry’s Blog for Economics and Finance
The chart above illustrates graphically the “higher education bubble” by comparing the annual increases in the CPI for “College tuition and fees” (7.45% per year since 1978) to annual increases in the CPI for “medical care” (5.8% per year since 1978) to annual increases in the median price for new homes (4.3% per year) to the annual increases in the “CPI for all items” (3.8% per year) 
[See more at: http://mjperry.blogspot.com/2011/07/higher-education-bubble-college-tuition.html#sthash.HF1DSyOu.dpuf ]
The good news, according to the Trends in Education Website, is that the rate of tuition increases is declining. Here below is a snippet from their Website.
Average Rates of Growth of Published Charges by Decade
The 2.9% one-year increase in average published tuition and fees for in-state students at public four-year institutions in 2013-14 was 0.9% after adjusting for inflation. This relatively small increase in prices means that despite very large annual increases earlier in the decade, tuition inflation between 2003-04 and 2013-14 was similar to that between 1983-84 and 1993-94.
Figure 4: Average Annual Percentage Increases in Inflation-Adjusted Published Prices by Decade, 1983-84 to 2013-14
See Key Points|See Also Important
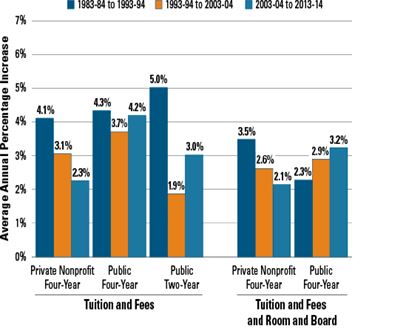
Each bar in Figure 4 shows the average annual rate of growth of published prices in inflation-adjusted dollars over a 10-year period. For example, from 2003-04 to 2013-14, average published tuition and fees at private nonprofit four-year colleges rose by an average of 2.3% per year beyond increases in the Consumer Price Index.
A third reason why so many college students are unable to pay their loans is the rising cost of financing those loans. Karen Weise recently wrote a an article in Business Week that laid out the problem of higher student loan rates. A snippet appears below.
Why Your Student Loan Interest Rate Is So High
By Karen Weise April 04, 2013
Business Week
Joe Szczepaniak pays a 3.5 percent interest rate on the mortgage for his house in a Chicago suburb. His car loan is 1.79 percent. The federal education loans he took out to send his four sons to college? They’re all above 7 percent. “Student loans have been the big black holes of my budget,” he says. Szczepaniak, who calls himself “Mr. Quicken” because he carefully tracks his finances, questions why the $200,000-plus he owes on the student loans doesn’t “reflect reality” and today’s low rates.
The answer is that Congress, not the market, sets rates for federal loans—which account for 85 percent of the roughly $1 trillion in outstanding education debt—and refinancing to a lower rate is rarely an option. Now some lawmakers and private lenders are looking for ways to give education borrowers more repayment and refinancing options.
[Read more at http://www.businessweek.com/articles/2013-04-04/why-your-student-loan-interest-rate-is-so-high ]
Student loan rate had been set to double, so congress acted to mitigate the sudden increase that was to occur. There is good information on the Consumer Financial Protection Bureau Website detailing the recent changes. An update on government student loan interest rates was recently published (see below). At a time when I can get a car loan from my credit union with an interest rate below 3%, our college students can’t get a federally subsidized student loan for under 3.86%, and private bank loans for students is even higher.
Consumer Financial Protection Bureau
Updated on August 13, 2013:
Last week, the president signed legislation passed by Congress to adjust federal student loan interest rates for this academic year. Here’s what the new rates look like:

http://www.consumerfinance.gov/blog/changes-to-federal-student-loan-interest-rates/
We have to stop and ask ourselves what the long term impact will be on our children and our economy if we don’t do more to make college affordable.
Living Wage Should Be Our Minimum Demand
Here are the facts: The federal minimum wage = $7.25 /hr. President Obama wants to raise it to $9.00 /hr. The current US Poverty wage = $10.60 /hr. The current living wage rate averages $16 to $23 /hr depending on where you live. The poverty wage rate and living wage rates are based on a 40 hour work week.
Profitable companies paying workers, or their out sourced or supply chain workers, less than a living wage are financially benefitting from government aid to the working poor. We need a stable work force to be competitive. We also can’t have people starving to death in the wealthiest nation on Earth. Companies take advantage of this and let state or federal governments step in to help care for their workers. This amounts to a labor discount. Cheap labor! Corporations are padding their profits at taxpayer expense.
At least 45% of working households require some form of government subsidy to maintain their financial stability. The cumulative effect of wage suppression over the past 40 years has become a huge taxpayer drain on households making more than the median income. While almost everyone’s wages are suppressed relative to GDP, the ranks of the working poor have grown to almost half of the work force. Business profits that have not been shared with workers over the years has gone instead to the wealtiest 1% of American’s creating the huge income inequality we have today.
In effect, profitable corporations and companies are making their higher paid employees subsidize part-time workers and full-time works who make less than a living wage.
So the next time you see that cleaning lady at work, remember your employer is expecting you to subsidize her family though income taxes rather than pay her the living wage she needs just to make ends meet. Every conservative argument against raising the minimum wage is just a smoke screen for the real culpret behind unemployment and our sluggesh economy, Wage Suppression!!!
Taxpayer Subsidized Downsizing in America
The business of quick and dirty layoffs has become a familiar feature in our culture. One recent example involved a journalist who worked at a large news organization. He was new to the company so he gratefully accepted the friendship of a well respected senior reporter. One Friday morning his mentor emailed him about a story idea and ended it by writing, “I’ll see you at the 10 AM meeting.” This prompted the following email exchange:
“What meeting? I didn’t get the email.”
“I’ll forward it do you.”
Then a short time later: “Forget the email. This meeting isn’t for you. Don’t come to this meeting!”
This is how the newsroom learned that day of the layoffs. Many senior journalists were let go along with a few younger reporters to avoid the appearance of age discrimination. As these “redundant” employees filed from the meeting they were handed garbage bags for their personal effects and accompanied to their desks by hired chaperones. It was all over in an hour.
Coolly calculated business decisions and pitiless firings toss employees off company books and onto government unemployment rolls somewhere in this country nearly every week. No notices, no outplacement services, no severance pay and no extended benefits are required. In many cases there is no effort to treat employees with the dignity or respect they deserve.
Apart from union contracts or employment agreements, American companies have no legal obligations to citizens being fired. They need not assume any responsibility for the impact it has on an employee, their family or their community. The only business costs of any significance are the premiums companies pay for government unemployment insurance. This easy, low cost ability to fire workers is called “workforce efficiency” and the U.S. is among the most efficient in the world. We ranks 12th out of 144 nations according to the study on global business competitiveness .
In most other advanced nations there are laws requiring companies to provide loyal employees with advanced layoff notices, severance pay and other benefits. These structural costs for downsizing may make businesses a little less competitive, but it brings significant benefits. It helps maintain a stable workforce and postpones government funded assistance to severed employees while they look for jobs. Requiring larger companies to provide mandatory severance benefits helps the nations absorb minor bumps in the economy without adding to problems by throwing people out of work at the first sigh of trouble. It also happens to be a humane way for citizens to treat one another.
Here in this country we treat our labor force as if it were a commodity to be bought and discarded at will. In the end, big business lets taxpayers foot most of the costs for unemployment benefits and supplemental welfare services for people out of work. At the same time the pro-business lobby pushes Congress for business tax breaks and budget cuts in the programs that help the workers they leave behind. Isn’t it time we stopped bowing to the pro-business lobby and stand up for the American worker?
Government Jobs Not Rebounding As In Past Recessions
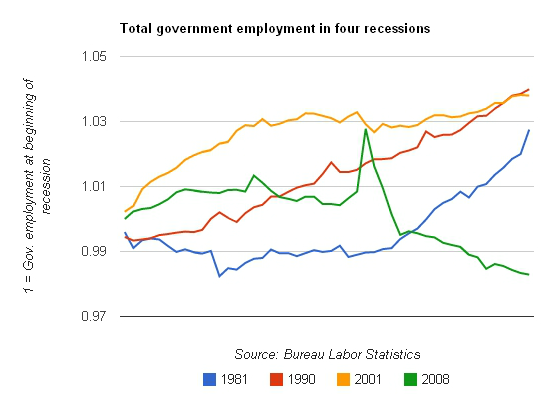

Public-sector austerity in one graph
On Friday, I ran some numbers on public-sector employment: Since Obama was elected, the public sector has lost about 600,000 jobs. If you put those jobs back, the unemployment rate would be 7.8 percent. [SNIP]
Today, Ben Polak, chairman of the economics department at Yale University, and Peter K. Schott, professor of economics at the Yale School of Management, widen the lens, with similar results: There is something historically different about this recession and its aftermath: in the past, local government employment has been almost recession-proof. This time it’s not. [SNIP] Go to like to read the rest of Ezra Klein’s article. Thank you.
Do Business Friendly Policies Reduce Poverty?
Do Business Friendly Policies Reduce Poverty?. A look at the numbers.
Wealth Redistribution Begins with A Fair Wage
When America’s wealthy elite talk of the redistribution of wealth it is a derisive term applied to federal aid to the working poor paid out of federal tax revenues. The rich are unhappy that some of their compensation goes to support low wage earners. But the growing need for federal aid to support working families is really a consequence of the unfair redistribution of wealth that takes place every working day.
Beginning around 1978 and continuing today, hourly employees have not received a fair wage for a days work. More specifically, hourly wages stopped keeping pace with the rise of hourly productivity (or GDP). Workers continued generating new wealth but they were no longer receiving a share in the additional wealthy they were creating. This simple fact, compounded over the decades, is the single most relevant factor behind our economic difficulties today. Below are some key findings from a report regarding how America’s wage earners are doing. It is from a report put out by the Economic Policy Institute.
THE STATE OF WORKINGAMERICA
Policy-driven inequality blocks growth for low- and middle-income Americans
http://stateofworkingamerica.org/fact-sheets/key-findings/
Daily stock indices, monthly employment reports, and even quarterly data on the gross domestic product are insufficient indicators for answering this vital question:
How well is the American economy providing acceptable growth in living standards for most households?
EPI’s The State of Working America, 12th Edition looks broadly at available data and concludes that the answer is simply “not well at all.”
This is not because the economy has failed to grow, on average. National income has grown enough to substantially improve the fortunes for all. As the data reveal, however, it is the top 5%, the top 1%, and fractions of the top 1 percent that have received almost all the benefits of the economy’s growth.
America’s low- and middle-income families have suffered a lost decade
22% – Despite an increase in productivity of more than 22 percent [between 2000 and] 2010, typical wage earners made roughly the same amount per hour as in 2000.
↓ 6% – Median family income was 6 percent lower in 2010 than in 2000.
This lost decade of no wage and income growth began well before the Great Recession—which started in Dec. 2007—battered wages and incomes. In the historically weak economic expansion following the 2001 recession, hourly wages and compensation failed to grow for either high school– or college-educated workers.
Another lost decade ahead?
Consensus forecasts predict that unemployment will remain high for many more years, suggesting that typical Americans are in for another lost decade of living standards growth. For example, as a result of persistent high unemployment, the incomes of families in the middle fifth of the income distribution in 2018 will likely still be below 2000 levels.
A generation of rising inequality.
156% – From 1979–2007, wages for the top 1 percent of wage earners grew 156 percent, compared to 17 percent for the bottom 90 percent.
60% – From 1979–2007, the top 1 percent of tax units claimed 60 percent of the cash, market-based income growth, compared to 9 percent for the bottom 90 percent.
38.3% – From 1983–2010, 38.3 percent of the wealth growth went to the top 1 percent and 74.2 percent to the top 5 percent. The bottom 60 percent, meanwhile, suffered a decline in wealth.
Rising inequality prevented wage growth for low- and middle-income workers
0.6% – From 1979–2007, incomes for the middle fifth of households grew, but the annualized rate of growth (0.6 percent) reflects a deep economic failure. This middle-fifth growth lagged far behind average growth over the same period, and pales in comparison to growth during earlier periods of history; between 1947 and 1979, for example, cash incomes (not even including expanded employer-provided and government in-kind benefits like health care) for the middle fifth of American families grew at an average annual rate of 2.4 percent—or four times as fast as what was achieved by the middle fifth of households between 1979 and 2007. If the middle fifth of the income distribution had grown at the average rate of income growth overall, these households would have had income $18,897 higher in 2007.
7% – The typical worker has not gained from improvements in the ability to produce more goods and services per hour worked (productivity growth). Between 1979 and 2011, productivity grew 69 percent, but median hourly compensation (wages and benefits) grew just 7 percent.
Policy choices generated inequality
Policy decisions made over the last several decades have caused this explosive rise in inequality. These decisions include: lowering individual and corporate tax rates; deregulating industries; failing to maintain the value of the minimum wage; failing to protect the right of workers to obtain collective bargaining; and failing to prevent asset bubbles.
Additional findings.
These sobering data could be mitigated by the ability of Americans to move freely up and down the income or wealth ladders (mobility). There is no evidence, however, that mobility has increased to offset rising inequality.
Further examination of the data through the lenses of race and ethnicity finds the overall data obscure the dramatically worse outcomes minorities face.
Gender gaps have been reduced in many of our labor market analyses. While due in large part to substantial gains for women, part of the closing of the gap has occurred because men have lost significant ground.
Half of All Full-time Employees Earn Less Than $19/hr.
Bureau of Labor Statistics
For release 10:00 a.m. (EDT) Thursday, October 18, 2012 USDL-12-2072
Technical information: (202) 691-6378 • cpsinfo@bls.gov • www.bls.gov/cps
Media contact: (202) 691-5902 • PressOffice@bls.gov
USUAL WEEKLY EARNINGS OF WAGE AND SALARY WORKERS THIRD QUARTER 2012
Median weekly earnings of the nation’s 103.6 million full-time wage and salary workers were $758 in the third quarter of 2012 (not seasonally adjusted), the U.S. Bureau of Labor Statistics reported today.
This was 0.7 percent higher than a year earlier, compared with a gain of 1.7 percent in the Consumer Price Index for All Urban Consumers (CPI-U) over the same period.
Data on usual weekly earnings are collected as part of the Current Population Survey, a nationwide sample survey of households in which respondents are asked, among other things, how much each wage and salary worker usually earns. (See the Technical Note.) Data shown in this release are not seasonally adjusted unless otherwise specified. Highlights from the third-quarter data are:
- Seasonally adjusted median weekly earnings were $765 in the third quarter of 2012, little changed from the previous quarter ($773). (See table 1.)
- On a not seasonally adjusted basis, median weekly earnings were $758 in the third quarter of 2012. Women who usually worked full time had median weekly earnings of $685, or 82.7 percent of the $828 median for men. (See table 2.)
- The female-to-male earnings ratio varied by race and ethnicity. White women earned 83.4 percent as much as their male counterparts, compared with black (93.2 percent), Hispanic (87.5 percent), and Asian women (73.1 percent). (See table 2.)
- Among the major race and ethnicity groups, median weekly earnings for black men working at full-time jobs were $633 per week, or 74.1 percent of the median for white men ($854). The difference was less among women, as black women’s median earnings ($590) were 82.9 percent of those for white women ($712). Overall, median earnings of Hispanics who worked full time ($556) were lower than those of blacks ($606), whites ($780), and Asians ($915). (See table 2.)
- Usual weekly earnings of full-time workers varied by age. Among men, those age 45 to 54 and 55 to 64 had the highest median weekly earnings, $976 and $980, respectively. Usual weekly earnings were highest for women age 35 to 64; weekly earnings were $740 for women age 35 to 44, $754 for women age 45 to 54, and $766 for women age 55 to 64. Workers age 16 to 24 had the lowest median weekly earnings, at $437. (See table 3.)
- Among the major occupational groups, persons employed full time in management, professional, and related occupations had the highest median weekly earnings—$1,300 for men and $948 for women. Men and women employed in service jobs earned the least, $530 and $440, respectively. (See table 4.)
- By educational attainment, full-time workers age 25 and over without a high school diploma had median weekly earnings of $464, compared with $648 for high school graduates (no college) and $1,170 for those holding at least a bachelor’s degree. Among college graduates with advanced degrees (professional or master’s degree and above), the highest earning 10 percent of male workers made $3,448 or more per week, compared with $2,311 or more for their female counterparts. (See table 5.)
Revision of Seasonally Adjusted Usual Weekly Earnings Data The Usual Weekly Earnings news release for the fourth quarter of 2012 will incorporate annual revisions to seasonally adjusted data for the number of full-time wage and salary workers and median weekly earnings in current dollars. (See table 1.) Estimates for constant (1982-84) dollar median weekly earnings also will be affected by revisions to the current dollar series. Seasonally adjusted estimates back to the first quarter of 2008 will be subject to revision.
Go to Tables: http://www.bls.gov/news.release/pdf/wkyeng.pdf
