Home » Posts tagged 'Capitalism'
Tag Archives: Capitalism
The Village We Left Behind
by Brian T. Lynch, MSW
I recently returned from a trip to my father’s birthplace in County Meath, Ireland where I took a walk around the village of Athboy. This is the town nearest Kildalkey where he grew up. Like so many villages in rural Ireland it is still owned and run by local inhabitants. There is a quaint little supermarket first opened by Ollie Byrd, my father boyhood friend. It’s now run by his son since Ollie passed away a few years ago.

Just up the sidewalk is Faulkner’s men’s shop owned and operated by Brian Faulkner, a cousin to my cousin, Sean. Three doors up the street is Faulkner’s Fashion House for woman, owned and run by his sister, Ger Faulkner. Across the street is the historic Darney Hotel where you can get a proper meal and a spot of tea in homey, low chic surroundings . On certain evenings you can go there to enjoy traditional Irish music in the hotel’s pub.
There are a handful of other pubs in town named after their proprietors. There is a family owned hardware store, a bakery, a post office that also serves as a general convenience store and a little gift shop run by a mother and daughter where you can buy small gifts for your friends and family on those special occasions.
The village is alive with shoppers. The streets are abuzz with cars, lories, public buses and farm tractors towing wagons of silage or farm equipment down the main street on their way from one field to the next. It is a place where people still know their neighbors and customers are greeted by their first name more often than not. Relationships are the real treasure you will find here.
It was a striking contrast to the sterile and impersonal world of cookie cutter malls and brand name store fronts in America today. It reminded me that we once had local commerce centered in small towns all across America. We had more civic pride back then, and a deep sense of connection with the people in the community where we shared our time and place. This is a way of living that is quickly disappearing. It is under siege in Ireland as it is everywhere around the globe wherever corporate profits can be extracted from local economies and brand recognition can replace familiar faces. In the process we have lost our connections between farmers and food, craftsmen and products, business owners and commerce.
I was told that all meat sold in Ireland had the name of the farmer and the farm where the livestock was raised. People in Ireland want to know exactly from where their food comes. So I wandered into Brogan’s Butcher Shop across from the post office to look for farm names on the products in the meat case. I was disappointed to find none. Had I been misinformed?
I asked the butcher behind the counter about this. He proudly pointed to the wall where a certificate of origin hung on a nail as he explained that all this meat came from his own family’s farm. “If you want to see a farmer’s name on a piece of meat you’ll have to head back to Ollie Byrd’s,” he said.
Contrast this with the US House of Representatives who on June 11th of this year passed a bill that would eliminate a law requiring country of origin labeling on all U.S. meats. “It sounds like you are heading backwards,” he said to me when I told him this. Indeed it does.
I read that over 90% of all American’s want to know from where their meat comes, and most people I know would love to know more about where all their food is grown. We can’t have real competition in the food industry as long as information like this is hidden from us. So what is behind the passage of this bill to block COOL (country of origin labeling)?
It turns out that Canadian and Mexican meat industry trade groups have sued the United States in the WTO (World Trade Organization) over COOL, saying it constitutes unfair trade practices under international treaties. Specifically, the WTO ruled that:
“The compliance panel found that the amended COOL measure violates Article 2.1 of the TBT Agreement because it accords to Canadian and Mexican livestock less favourable treatment than that accorded to like US livestock. In particular, the compliance panel concluded that the amended COOL measure increases the original COOL measure’s detrimental impact on the competitive opportunities of imported livestock in the US market, because it necessitates increased segregation of meat and livestock according to origin; entails a higher recordkeeping burden; and increases the original COOL measure’s incentive to choose domestic over imported livestock.”
This is what we are up against. Giant international corporations battling each other beyond the reach of sovereign countries to create a world more suitable for their financial conquests. Congressional supporters of the measure to eliminate COOL are seeking to avoid the $3.6 billion in potential retaliatory tariffs sought by Canada and Mexico. In the mean time, the US livestock census is at near record lows while beef prices keep climbing into record high territory. What people want no longer matters.
De-Cantoring Big Business
by Brian T. Lynch, MSW

The defeat of Eric Cantor in his primary, and the article below, is instructive because it illuminates the growing populist enmity towards politicians who serve business interests over voter interests. This is at the heart of the growing rift in the Republican party. The GOP establishment serves the interests of Big business over all else and almost mockingly manipulate ordinary voter segments and the small business owners they claim as their base.
The beltway seems baffled by this, but the trend has been clear for some time. Putting people first in politics will be key to winning over the real voter base of both parties going forward. And peeling off small business owners by promoting specific policies that support them and level their playing field against corporate abuses is an essential element for Democrats. Democrats should be the champions of small community business leaders and ordinary citizens. They should be resist the growing corporate influence over government and our lives (without being overtly hostile).
Campaign funding should also be as populist and grass roots as possible, or at least have that as a prominent feature. People should be able to contribute small donations to their candidate’s campaign on line using their pay pal accounts, or they should be able to text a contribution on their smart phone. This not only sets the right tone, it takes action against the influence of big money in politics even if particular campaign must still rely on big donors.. But note that in this race Eric Cantor outspent Brat by a 40 to 1 ratio. The strength of Brats message overcame this huge spending advantage.
As I tweeted earlier today in reference to Cantor: In drawing democrat-proof districts the GOP created congressional district that are toxic to traditional conservative Republicans as well. And traditional conservative Republicans are virtually all big business Republicans. So there is a clear message here for all Democratic candidates. Stop cozening up with corporations and start representing real people.
If Democrats messaging can thread this needle they may be able to pick up disaffected moderate Republican votes while making it harder for radical right-wing Republican’s to vote for GOP supporter of ever more crony capitalism.
Here is a snip of the Nation’s article by John Nicols:
from The Nation
Breaking news and analysis of politics, the economy and activism.
Eric Cantor Defeated by a Conservative Who Rips Crony Capitalism
John Nichols on June 11, 2014 – 12:21 AM ET
http://www.thenation.com/blog/180189/eric-cantor-defeated-conservative-who-rips-crony-capitalism#
The DC-insider storyline about this being a great year for the Republican establishment is undergoing a rapid rewrite. For the first time since the post was formally established in 1899, a House majority leader has been defeated in a bid for renomination. And as political prognosticators, Republican stalwarts and savvy Democrats search for explanations, they are being forced to consider complexities they had not previously entertained — including the prospect of conservatives who are ready and willing to criticize big business.
Eric Cantor, the face of the GOP establishment, one of the party’s most prodigious fundraisers and the odds-on favorite to become the next speaker of the House, lost his Virginia Republican primary Tuesday to a challenger who promised, “I will fight to end crony capitalist programs that benefit the rich and powerful.”
Dave Brat, who defeated the number-two Republican in the House by a 56-44 margin, tore into big business almost as frequently as he did the incumbent. “I am running against Cantor because he does not represent the citizens of the 7th District, but rather large corporations seeking insider deals, crony bailouts and a constant supply of low-wage workers,” declared the challenger.
Image credit: www.businessinsider.com
Coal Ash Disaster Turns Capitalists into Socialists (Again)
by Brian T. Lynch, MSW
Commentary:
Coal ash is what’s left after coal is burned. It’s a toxic stew containing heavy metals including arsenic, lead and mercury. For many years Duke Energy has mixed coal ash with water and pumped this cocktail from coal fired power plants into huge open pits. In February, one of the sludge pits located in North Carolina began releasing millions of gallons of toxic coal ash into the Dan River, a source of public drinking water for thousands of people.

Photo and article: http://www.salon.com/2014/02/26/north_carolina_might_finally_crack_down_on_duke_energy_after_disastrous_coal_ash_spill/
Duke Energy spent millions over the years to keep government from properly regulating their waste products. For all those decades the stockholders and upper management of Duke energy have profited from this arrangement. Now that the inevitable has occurred, clean up effort will take years and cost a billion dollars. Millions more will have to be spent to correct the improper disposal problems that Duke Energy has practiced for decades.

Safely storing coal ash should have been a cost of doing business for Duke Energy all along, but they have deferred that cost to boost their profits. Now Duke Energy’s president and CEO, Lynn Good, thinks taxpayers should bear the cleanup costs. She said, “Ash pond closure has been a plan for very long time. And because that ash was created over decades for the generation of electricity, we do believe that ash pond disposal costs are ultimately a part of our cost structure.” She believes the burden of this clean up should be shared by everyone equally. (Corporate socialism? Again?)
Corporation are legally obligated to maximize profits for their shareholders. This would be fine if they were also legally obligated to paid the full cost of doing business without cutting corners. Cleaning up toxic spills is far more expensive than preventing themand regulations to enforce safe disposal are less expensive in the long run. But asking the victims of their environmental crimes to pay for cleaning up their mess and fixing their problem should not be an option.
(See also: http://www.politicususa.com/2014/03/14/republican-hypocrites-force-nc-taxpayers-pay-duke-energys-toxic-coal-ash-dumping.html )
Tyranny of the Minority – Part 2: Rise of the Neo-Confederate Secessionists
Graycoat Conservatives – The Neo-Confederate Secessionists
by Brian T. Lynch, MSW
They are still small in number, but spread widely across the county. They are articulate, highly motivated and influential members within the Tea Party, the Christian right movement, Libertarians groups and nationalist groups in every state. They are the philosophic rear guard of the conservative movement pulling conservatives ever further to the right. They may not have a central organization, but they do have a significant social media presence. They remain under the radar of the national press which fails to take them seriously. The best way to find them is to type “secessionist” into your internet search engine. They are the Neo-Confederates, a polarizing counter-force behind the growing rift in the Republican Party.
The secessionists anti-government interests overlap with the corporate conservative wing of the Republican Party, and both groups favor free market economics, but the graycoat conservatives envision a very different America. So while wealthy conservatives continue to fund the Tea Party, graycoat conservatives are busy winning over hearts and minds to their radical alternative.
The following graphic is taken from one of the many secessionist Websites. It maps the number of secessionist petitioners from around the country. In effect it shows where they are most active and how they are distributed across the country. It doesn’t represent how popular or unpopular the movement might be.
Plotting whitehouse.gov secession petitions

Signers to White House secession petitions by county. Color based on proportion of residents signing, with darker colors showing higher levels of secession support. Current as of 9am on Saturday, November 24th. Works best in Chrome or Safari.
Update: It looks like the secession petition movement has peaked.
Since Election Day, more than 60 petitions have been posted on the White House’s website requesting that states be allowed to withdraw from the United States and create their own government. As of November 13, 2012, the following states had active petitions: Alabama, Alaska, Arizona, Arkansas, California, Colorado, Delaware, Florida, Georgia, Idaho, Illinois, Indiana, Kansas, Kentucky, Louisiana, Michigan, Minnesota, Mississippi, Missouri, Montana, Nebraska, Nevada, New Hampshire, New Jersey, New Mexico, New York, North Carolina, North Dakota, Ohio, Oklahoma, Oregon, Pennsylvania, Rhode Island, South Carolina, South Dakota, Tennessee, Texas, Utah, Virginia, Virginias, West Virginia, Wisconsin, and Wyoming. [http://www.unc.edu/~ncaren/secessionists/]
A 2009 Zogby poll quoted on a number of secessionist Websites found that 20% of American’s believe states have a right to secede from the Union. Just today (12/18/13) Michael Hill, President of one of the Southern groups called League of the South, posted ten reasons for secession. They are:
- The U. S. government is an organized criminal enterprise, secession is the only way to return to legitimate government
- The U. S. economy is failing, secession makes economic sense
- The South’s unique history and culture is worth protecting
- The criminal nature of the bank bailouts and the Fed
- A dysfunctional national electoral system, secession may be the only way to restore integrity to elections
- Third World immigration into the South, secession removes the federal government’s interference and lack of performance
- Organic community vs. the globalism of the elites
- The implementation of an American police/surveillance state
- The Christian South v. secular America, secession provides the opportunity to return to Our Founding Principles
10. Because we think we can rule ourselves better than we are being ruled by DC, secession is a path to American Liberty http://dixienet.org/rights/2013/reasons_for_secession.php]
What these secessionist groups most have in common is a desire to facilitate the collapse of the Federal Government and the breakup of the Union of States. They see this as the natural and inevitable course of history. As they see it, every great empire has followed this path.

They oppose all forms of collectivism and eschew society as we know it. Among some groups there is a distinct “cultural” component. All groups seem to reject democratic majority rule. As one of them put it to me, ”
According to one person who wrote me, they are, “… committed to the cause of individual liberty and [individual] sovereignty. [They] would prefer secession, to revolution.” But revolution it will be if the majority opinion of the Americans go against them. They have a strong patriotic connection to our founding fathers even though their commitment to our Union is weak. Pin them down and they reluctantly choose the union of states over a return to a confederacy, but only if the Federal governments control over the states is weakened and individuals are free from all federal interference.
If you start to pin these folks down in a debate they squirm away. They are viscerally opposed to the our system of government, their anti-federal rage concealed only by their passion for an extreme interpretation of individual rights and freedoms. These passions are covered over by a thin veneer of selective scholarship. Scratch the scholarship and their passion flares. Challenge their constitutional interpretations and they circle the wagons.
They have no sense of responsibility towards society and nothing but contempt for majority rule. They believe the majority of American’s is just another special interest group, and one that is biased against minority rights. When majorities opinions prevail they force minorities to accede to their will which violates their rights. This is how they interpret the Constitution.
The only legitimate role they see for the federal government is the protection of the individual’s right to follow their conscience within Constitutionally defined boundaries. One major flashpoint seems to be taxes. They don’t want to pay any federal taxes, but when pressed say they agree to contribute only for spending within the limits of their narrow interpretation of the governments enumerated powers.
They resent being forced to pay taxes for national parks, education, environmental protection, food and drug administration, foreign diplomacy administration or anything else that isn’t specifically named in our Constitution. They claim a sovereign right not to pay for anything outside of the federal governments enumerated powers, as they define it. They reject all collectivism. For example they resent that the Federal government spends any money on highways and bridges, believing federal spending should be restricted to “postal roads.”
As one person wrote: ” For [the federal government] to “do” it must take. That violates rights. The only function of [government] is protect rights, not “do.”
Tenth Amendment: The powers not delegated to the United States by the Constitution, nor prohibited by it to the States, are reserved to the States respectively, or to the people.
The 10th Amendment is the source of their narrow interpretation of federal powers. Their interpretation provides all the justification they require. Below is a reprint from one of their Websites that lists the enumeration of federal powers which they feel the government has exceeded. These powers are listed on the Tenth Amendment Center Website where the members call themselves “Tenthers.: [http://tenthamendmentcenter.com/]
Disdain for the Federal Government or any large democracy is a central feature for these neo-confederate groups. They see majority as a special interest and would strip the government of its ability to show any favoritism to all special interests. This suggests that the only role of government must be the protection of the individuals rights yet they may concede collective rights to businesses. Perhaps this is why it is so important that corporations be viewed as people. It gives them individual status while denying other types of organization status as a collective entity.
MIDDLEBURY INSTITUTE PAPER V
http://middleburyinstitute.org/rightsandfreedoms.html
March 2007 – Introduction to “Minimal Rights and Freedoms of Individuals in a Sovereign State”
Because questions keep coming up as to the kinds of states that secessionist organizations are working toward, and because each organization in the movement has an interest in the objectives of any other organization, it seemed to us here that it might be appropriate to send out a suggested platform of the rights and freedoms that might be guaranteed to individuals in any future seceded state. [SNIP] There are important issues here and we hope you take them seriously.
MINIMAL RIGHTS AND FREEDOMS OF INDIVIDUALS IN A SOVEREIGN STATE
Rights to
Life, liberty, security
Equality before the law
Trial before competent tribunal, due process, counsel, appeal
Possess property and not be arbitrarily deprived thereof
Periodic elections with universal adult suffrage
Secession by any coherent unit
Freedoms of
Speech, opinion, expression in any media
Peaceable assembly, association
Belief, thought, religion, worship
Movement within any state, and to leave and return
Freedoms from
Slavery or servitude
Discrimination on the basis of race, color, sex, religion,
political belief, nationality, property, or birth
Torture or degrading treatment
Arbitrary arrest or detention
Invasion of privacy
Arbitrary deprivation of citizenship
Any action by the state to destroy or deny any of these rights and freedoms
Signators:
Middlebury Institute, February 2007
Second Vermont Republic, March 2007
Southern National Congress Committee, March 2007
The role of a state to infringe on individual rights is not well thought out among members of this group. Because states are smaller they believe them to be inherently less intrusive in the lives of individuals. They consider themselves to have an individual right to not be “interfered with” by any government, but apparently feel that smaller, state governments would be easier to control. In a large constitutional democracy, such as the United States, a majority opinion is viewed as a form of tyranny against individual dissenters, even if that majority opinion is deemed constitutional according the the Supreme Court. On the other hand, they don’t see anything wrong with a minority group preventing the majority from governing in opposition to them. They see this as their right and duty as “soverigien citizens.” It isn’t clear whether this is true only when the minority feels the government is legislating beyond its enumerated powers, or if they claim this right under all circumstances. As one person put it:
“But you don’t see that resisting (but not compelling) action from a majority isn’t a tyranny of the minority? The minority isn’t forcing the majority to do anything, only to refrain from forcing the minority to do something. The rights of any minority supersede the wants or needs of any majority.”
In the face debt ceiling financial cliffs, government shut downs, and the nearly total inability of Congress to pass legislation, it is time to recognize that there are forces on the far right, and in Congress, who see this as successful strategy. Their intentions are malevolent and quite contrary to the motivations most often attributed to them by political analysts in the main stream press. It is time to pay attention to these groups and their impact on American politics. A failure to open a public debate that directly confronts both the graycoat secessionists and the corporate elite now would be a huge mistake.
Four Graphs on What Hurts the Working Class
We never hear any reference to the working class these days. The media and our politicians only speak of the “middle class” as if that covers everyone who isn’t either poor or wealth. Even references to the poor are scarce. The working class exists. They are sandwiched between the poor and the middle class and they are being squeezed into poverty. It is cruel to ignore them and the terrible pain they are suffering. What has happened to them, aside from being ignored can only be touched on by the four graphs that follow. These were presented in a conversation I had with conservative friend of mine who has forgotten the working class exists. There are many factors hurting the working class. This conversation was only about four factors, wage suppression, the upward redistribution of wealth, working class decent into poverty and declining upward mobility. Post this is my way of addressing what I believe is the most hurtful factor of them all… public silence.
Q: I always thought of the owners as the producers of the jobs that the workers have. You say that it is the workers who are the producers. Have you ever been employed by someone on welfare?
A: Owners coordinate the workforce, but it the employees who do the work that makes the products or services. So in a real sense, the workers ARE the producers. And this has nothing to do with welfare at all. Jobs are not a product. Stuff is a product. Things to sell or trade is a product. Workers are key to making stuff or offering stuff yet when they want a fair share of the value they create they are treated like thieves. Read this and you will know what I am talking about even if you don’t agree:
http://aseyeseesit.blogspot.com/…/fair-wage-for-days…

I also just ran across this table (below) that shows were all the Hourly GDP wealth has gone since the mid-’70’s.
Source: https://scontent-a-lga.xx.fbcdn.net/hphotos-prn2/1480602_10200873563747333_1576469932_n.jpg
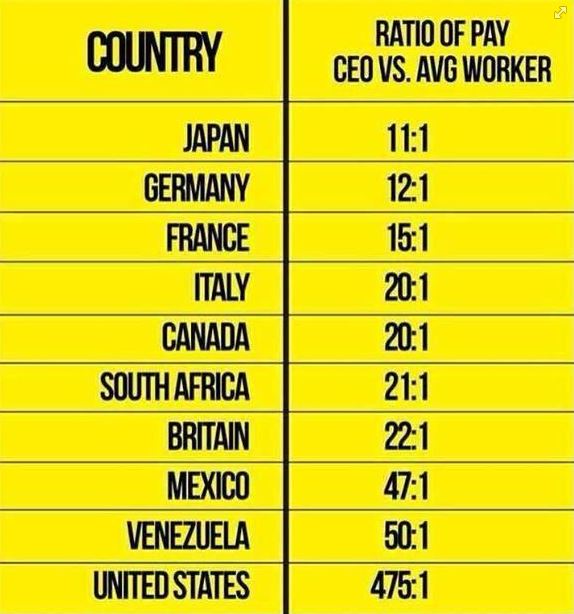
Q: Why should it matter how much a C.E.O. makes if their workers remain on the job? It’s one of the great things about this country. You can work where ever and for whom ever you want. Someone please explain to me why it is greed for C.E.O.’s to make deals to be paid as much as the market will bear but it is ok for workers to make deals to make as much as the market will bear.
A: It may not matter to you at all, but anyone who wonder why they can’t have collective barganing while the CEO is making 400 times their salary might have questions, especially since this is strictly a feature of the US economy and others around the world are paid better than we are relative to their economies.
Don’t forget, almost 40% of people who work full time are poor. I’m not sure what percentage of the poor they account for, but it is clear when we speak of the poor we are not speaking only of people who are disabled, elderly, retired or unemployed.

http://upload.wikimedia.org/wi…/en/7/74/Pov_crossnatl.jpeg
Note here that in the US, the number of working poor (blue bar in right hand column) is twice the number of non-working poor. So when you and I talk about the poor, you are defining it as welfare recipients while I broadly define it as everyone living below the poverty line, the majority of whom work full time. That’s partly why we have a disconnect on this topic. In my understanding, most poor people work.
Q: I wonder how many of the poor who are now C.E.O.’s would agree with you? Or would they say : “Work hard towards your goal, as I did, and you can achieve anything.”. Isn’t this what made our economy great? Not people who wanted a wage so they could be comfortable in the position they have today? Flipping burgers at McDonalds is not supposed to be a permanent career goal. Even the management at McDonalds wants people to move up. Or am I wrong about incentive and ambition?
A: There are 17,000 companies with 500 employees or more. There are 43 million poor. If 20% of CEO’s started out as poor children that would mean there are only about 4,200 CEO openings for 43 million potential applicants. It’s a safe bet that far fewer than 20% of CEO’s come from poverty. In fact, less than 20% of children born to poorest families will make it into the middle class in their lifetime. Less than 8% will make over $140k/year, which is approximately the income line where the richest fifth starts. Of those at the top, only the smallest fraction will become a CEO. I believe that if you really understood the economic situation in America you, of all the folks I know, would be a big supporter of the working class.

source: http://www.pewtrusts.org/…/Eco…/PEW_Upward%20EM%2014.pdf
As for incentive and ambition, a good paying job that makes one economically self-sufficient is the highest motivator. But a self-sufficient wage for a single earners is over $30,000/year whereas the median wage for a single earners is less than $26,000/year. In other words, the incentives are less than optimal in today’s economy, and no amount of hard work or individual effort will make a difference for most people until even low wage workers receive a fair wage for a days work.
The Economy Didn’t Stall for Congress During Recession
by Brian T. Lynch, MSW
|
The Wealthiest US Legislators Estimated Net Worth
|
|
|
Issa, Darrell (R-Calf) House
|
$448,125,017
|
|
McCaul, Michael (R-Tex) House
|
$380,411,527
|
|
Harman, Jane (D-Calf) House
|
$326,844,751
|
|
Kerry, John (D-Mass) Senate
|
$231,722,794
|
|
Kohl, Herb (D-Wis) Senate
|
$173,538,010
|
|
Combined Wealth
|
$1,560,642,099
|


|
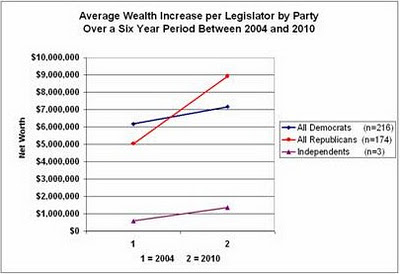
Average Wealth Increase per Legislator by Party and Chamber – 2004 and 2010
|
|||||
|
Wealth /Member in 2004
|
Wealth /Member in 2010
|
Six Year Dif /Member
|
Total % Change
|
Annual % Change
|
|
|
House Democrats (n=176)
|
$2,918,824
|
$4,408,237
|
$1,489,414
|
51.0%
|
8.50%
|
|
House Republicans (n=133)
|
$5,243,557
|
$10,111,971
|
$4,868,414
|
92.8%
|
15.47%
|
|
Senate Democrats (n=40)
|
$20,516,818
|
$19,323,256
|
-$1,193,561
|
-5.8%
|
-0.97%
|
|
Senate Republicans (n=41)
|
$4,394,130
|
$5,128,482
|
$734,352
|
16.7%
|
2.79%
|
|
Senate Independents (n=3)
|
$577,182
|
$1,359,855
|
$782,673
|
135.6%
|
22.6%
|


|
Total Wealth Increase of All US Legislators Between 2004 and 2010
|
|||||
|
Average Wealth in 2004
|
Average Wealth in 2010
|
Difference in Six Years
|
Total % Change
|
Annual % Change
|
|
|
All Members (n=393)
|
$2,213,699,631
|
$3,108,019,528
|
$894,319,897
|
40.4%
|
6.7%
|
|
All Democrats (n=216)
|
$1,334,385,659
|
$1,548,780,022
|
$214,394,363
|
16.1%
|
2.7%
|
|
All Republicans (n=174)
|
$877,552,427
|
$1,555,159,941
|
$677,607,514
|
77.2%
|
12.9%
|
|
Independents (n=3)
|
$1,731,545
|
$4,079,565
|
$2,348,020
|
135.6%
|
22.6%
|
|
Senators (n=84)
|
$1,002,563,604
|
$987,277,595
|
-$15,286,009
|
-1.5%
|
-0.3%
|
|
Congressmen (n=309)
|
$1,211,147,532
|
$2,120,971,945
|
$909,824,413
|
75.1%
|
12.5%
|
|
Average Wealth Increase Per US Legislator by Party and Chamber Between 2004 and 2010
|
|||||
|
Wealth /Member in 2004
|
Wealth /Member in 2010
|
Six Year Dif /Member
|
Total % Change
|
Annual % Change
|
|
|
All Members (n=393)
|
$5,632,823
|
$7,908,447
|
$2,275,623
|
40.4%
|
6.7%
|
|
All Democrats (n=216)
|
$6,177,711
|
$7,170,278
|
$992,566
|
16.1%
|
2.7%
|
|
All Republicans (n=174)
|
$5,043,405
|
$8,937,701
|
$3,894,296
|
77.2%
|
12.9%
|
|
Independents (n=3)
|
$577,182
|
$1,359,855
|
$782,673
|
135.6%
|
22.6%
|
|
Senators (n=84)
|
$11,935,281
|
$11,753,305
|
-$181,976
|
-1.5%
|
-0.3%
|
|
Congressmen (n-309)
|
$3,919,571
|
$6,863,987
|
$2,944,416
|
75.1%
|
12.5%
|
|
Average Wealth Increase of All US Legislators by Party Between 2004 and 2010
|
|||||
|
Average Wealth in 2004
|
Average Wealth in 2010
|
Difference in Six Years
|
Total % Change
|
Annual % Change
|
|
|
House Democrats (n=176)
|
$513,712,948
|
$775,849,769
|
$262,136,821
|
51.0%
|
8.50%
|
|
House Republicans (n=133)
|
$697,393,079
|
$1,344,892,164
|
$647,499,085
|
92.8%
|
15.47%
|
|
Senate Democrats (n=40)
|
$820,672,711
|
$772,930,253
|
-$47,742,458
|
-5.8%
|
-0.97%
|
|
Senate Republicans (n=41)
|
$180,159,348
|
$210,267,777
|
$30,108,429
|
16.7%
|
2.79%
|
|
Senate Independents (n=3)
|
$1,731,545
|
$4,079,565
|
$2,348,020
|
135.6%
|
22.6%
|
|
Average Wealth Increase per Legislator by Party and Chamber – 2004 and 2010
|
|||||
|
Wealth /Member in 2004
|
Wealth /Member in 2010
|
Six Year Dif /Member
|
Total % Change
|
Annual % Change
|
|
|
House Democrats (n=176)
|
$2,918,824
|
$4,408,237
|
$1,489,414
|
51.0%
|
8.50%
|
|
House Republicans (n=133)
|
$5,243,557
|
$10,111,971
|
$4,868,414
|
92.8%
|
15.47%
|
|
Senate Democrats (n=40)
|
$20,516,818
|
$19,323,256
|
-$1,193,561
|
-5.8%
|
-0.97%
|
|
Senate Republicans (n=41)
|
$4,394,130
|
$5,128,482
|
$734,352
|
16.7%
|
2.79%
|
|
Senate Independents (n=3)
|
$577,182
|
$1,359,855
|
$782,673
|
135.6%
|
22.6%
|
|
Top Ten Legislators /w Biggest Jump in Wealth ($ increase) by Party and Chamber – 2004 and 2010
|
|||||
|
Aggregated Totals
|
Average Wealth in 2004
|
Average Wealth in 2010
|
Difference in Six Years
|
Total % Change
|
Annual % Change
|
|
House Democrats (n=176)
|
$327,705,235
|
$568,142,204
|
$240,436,969
|
73.4%
|
12.2%
|
|
House Republicans (n=133)
|
$331,746,289
|
$1,005,864,579
|
$674,118,290
|
203.2%
|
33.9%
|
|
Senate Democrats (n=40)
|
$137,206,389
|
$216,341,049
|
$79,134,660
|
57.7%
|
9.6%
|
|
Senate Republicans (n=41)
|
$21,576,271
|
$81,888,741
|
$60,312,470
|
279.5%
|
46.6%
|
|
Top Ten Legislators /w Biggest Jump in Wealth ($ increase) by Party and Chamber – 2004 and 2010
|
|||||
|
Average per Legislator
|
Wealth /Member in 2004
|
Wealth /Member in 2010
|
Six Year Dif /Member
|
Total % Change
|
Annual % Change
|
|
House Democrats (n=176)
|
1,861,962
|
3,228,081
|
1,366,119
|
73.4%
|
12.2%
|
|
House Republicans (n=133)
|
2,494,333
|
7,562,892
|
5,068,559
|
203.2%
|
33.9%
|
|
Senate Democrats (n=40)
|
3,430,160
|
5,408,526
|
1,978,367
|
57.7%
|
9.6%
|
|
Senate Republicans (n=41)
|
526,251
|
1,997,286
|
1,471,036
|
279.5%
|
46.6%
|
|
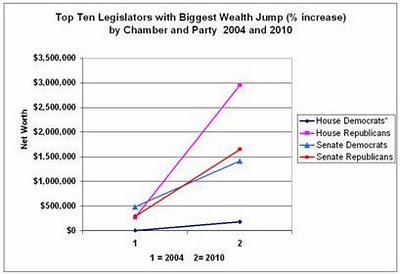
Top TenLegislators /w Biggest Jump in Wealth (% increase) by Chamber & Party – 2004 and 2010
|
|||||
|
Aggregated Totals
|
Average Wealth in 2004
|
Average Wealth in 2010
|
Difference in Six Years
|
Total % Change
|
Annual % Change
|
|
House Democrats*
|
$779,531
|
$31,996,557
|
$31,217,026
|
4004.6%
|
667.4%
|
|
House Republicans
|
$35,430,212
|
$392,877,862
|
$357,447,650
|
1008.9%
|
168.1%
|
|
Senate Democrats
|
$19,415,702
|
$56,516,827
|
$37,101,125
|
191.1%
|
31.8%
|
|
Senate Republicans
|
$11,871,405
|
$67,686,976
|
$55,815,571
|
470.2%
|
78.4%
|
|
Top TenLegislators /w Biggest Jump in Wealth (% increase) by Chamber & Party – 2004 and 2010
|
|||||
|
Average per Legislator
|
Wealth /Member in 2004
|
Wealth /Member in 2010
|
Six Year Dif /Member
|
Total % Change
|
Annual % Change
|
|
House Democrats*
|
$4,429
|
$181,799
|
$177,369
|
4004.6%
|
667.4%
|
|
House Republicans
|
$266,393
|
$2,953,969
|
$2,687,576
|
470.2%
|
78.4%
|
|
Senate Democrats
|
$485,393
|
$1,412,921
|
$927,528
|
191.1%
|
31.8%
|
|
Senate Republicans
|
$289,546
|
$1,650,902
|
$1,361,355
|
470.2%
|
78.4%
|
|
* One member, P. Kennedy, accounted for most of the increase. Excluding him for the in rank on the list yeilds an increase of 1,602.6% or 267.1% annual increase.
|
|||||
Labor Day – A Day for Reflection
Labor Day. For much of the world this is a day of reflection to honor the martyrs who stood up to wealthy capitalists in the fight for dignified employment, the eight-hour workday and the five-day work week. It is a day to honor those who sacrificed their lives so that we might be home in time to eat dinner with our families and to have Saturday’s off to watch our children play baseball or soccer. It is a reminder that many of the blessings we take for granted today came at a terrible price. If we forget how we got these benefits they will slowly erode over time and history will reap itself.
Much of the world celebrates Labor Day not in August, but in May. Have you ever wondered why? Would you be surprised to learn that labor celebrations around the world commemorate events that took place in Chicago in 1816? Students of history will recognize this as the Haymarket, or May Day Massacre. Below is one account from the Encyclopedia of Chicago History via Wikipedia. http://www.encyclopedia.chicagohistory.org/pages/571.html
Haymarket and May DayLABOR UNREST, 1886 (MAP)
On May 1, 1886, Chicago unionists, reformers, socialists,anarchists, and ordinary workers combined to make the city the center of the national movement for an eight-hour day. Between April 25 and May 4, workers attended scores of meetings and paraded through the streets at least 19 times. On Saturday, May 1, 35,000 workers walked off their jobs. Tens of thousands more, both skilled and unskilled, joined them on May 3 and 4. Crowds traveled from workplace to workplace urging fellow workers to strike. Many now adopted the radical demand of eight hours’ work for ten hours’ pay. Police clashed with strikers at least a dozen times, three with shootings. At the McCormick reaper plant, a long-simmering strike erupted in violence on May 3, and police fired at strikers, killing at least two. Anarchists called a protest meeting at the West Randolph Street Haymarket, advertising it in inflammatory leaflets, one of which called for “Revenge!” The crowd gathered on the evening of May 4 on Des Plaines Street, just north of Randolph, was peaceful, and Mayor Carter H. Harrison, who attended, instructedpolice not to disturb the meeting. But when one speaker urged the dwindling crowd to “throttle” the law, 176 officers under Inspector John Bonfield marched to the meeting and ordered it to disperse. Then someone hurled a bomb at the police, killing one officer instantly. Police drew guns, firing wildly. Sixty officers were injured, and eight died; an undetermined number of the crowd were killed or wounded. The Haymarket bomb seemed to confirm the worst fears of business leaders and others anxious about the growing labor movement and radical influence in it. Mayor Harrison quickly banned meetings and processions. Police made picketing impossible and suppressed the radical press. Chicago newspapers publicized unsubstantiated police theories of anarchist conspiracies, and they published attacks on the foreign-born and calls for revenge, matching the anarchists in inflammatory language. The violence demoralized strikers, and only a few well-organized strikes continued. Police arrested hundreds of people, but never determined the identity of the bomb thrower. Amidst public clamor for revenge, however, eight anarchists, including prominent speakers and writers, were tried for murder. The partisan Judge Joseph E. Gary conducted the trial, and all 12 jurors acknowledged prejudice against the defendants. Lacking credible evidence that the defendants threw the bomb or organized the bomb throwing, prosecutors focused on their writings and speeches. The jury, instructed to adopt a conspiracy theory without legal precedent, convicted all eight. Seven were sentenced to death. The trial is now considered one of the worst miscarriages of justice in American history. Many Americans were outraged at the verdicts, but legal appeals failed. Two death sentences were commuted, but on November 11, 1887, four defendants were hanged in the Cook County jail; one committed suicide. Hundreds of thousands turned out for the funeral procession of the five dead men. In 1893, Governor John Peter Altgeld granted the three imprisoned defendants absolute pardon, citing the lack of evidence against them and the unfairness of the trial. Inspired by the American movement for a shorter workday, socialists and unionists around the world began celebrating May 1, or “May Day,” as an international workers’ holiday. In the twentieth century, the Soviet Union and other Communist countries officially adopted it. The Haymarket tragedy is remembered throughout the world in speeches, murals, and monuments. American observance was strongest in the decade before World War I. During the Cold War, many Americans saw May Day as a Communist holiday, and President Eisenhower proclaimed May 1 as “Loyalty Day” in 1955. Interest in Haymarket revived somewhat in the 1980s. A monument commemorating the “Haymarket martyrs” was erected in Waldheim Cemetery in 1893. In 1889 a statue honoring the dead police was erected in the Haymarket. Toppled by student radicals in 1969 and 1970, it was moved to the Chicago Police Academy. |

Market Logic’s Irrational Origin
In a side comment by Tim Worstall in his recent Forbes commentary, he says: “… if the social costs of climate change were clearly and obviously larger than the consumer benefits of CO2 emissions then we wouldn’t actually have a problem with climate change at all.” He says people would see the soical costs and stop using fossil fules.
That’s like saying smokers would stop smoking if they believed their collective habit raised national health care costs and caused premature death among their cohorts. People still smoke who believe this because human behavior is not so rational. Both of these are also examples of just how limited the logic of the market place really is. It’s limited because it relies on collective human behavior rather than human intellect for its logic. And this is precisely why we sometimes need government actions to supersede illogical market outcomes.
Visualizing Our Wealth Inequality
Wealth Inequality in America
Does Philanthropy End Up Hurting the Poor and Vulnerable?
What follows is my response to an open discussion about the role and social value of philanthropic foundations. It is my response to the lead article by Dr. Rob Reich, which can be read in its entirity at the URL below.
BOSTON REVIEW
http://www.bostonreview.net/BR38.2/ndf_rob_reich_foundations_philanthropy_democracy.php#c5t_form
Lead Essay:
What Are Foundations For?
Rob Reich
This article leads off our debate on philanthropy, with responses from Stanley Katz, Diane Ravitch, Larry Kramer, and others.
 Graham Smith
Judge Richard Posner, one of the foremost American jurists outside the Supreme Court, once observed, “A perpetual charitable foundation . . . is a completely irresponsible institution, answerable to nobody. It competes neither in capital markets nor in product markets . . . and, unlike a hereditary monarch whom such a foundation otherwise resembles, it is subject to no political controls either.” Why, he wondered, don’t we think of these foundations as “total scandals”?
If foundations are total scandals, then we have a massive problem on our hands. We are now living through the second golden age of American philanthropy. What Andrew Carnegie and John D. Rockefeller were to the early twentieth century, Bill Gates and Warren Buffett are to the early twenty-first century.
The last decade of the twentieth century witnessed the creation of unprecedentedly large foundations, such as Gates’s. The assets of the Gates Foundation and a separate Gates Trust, which holds wealth donated by the Gates family and Buffett, together total more than $65 Billion. If the combined entities were a nation, it would be 65th on the world GDP list. And it’s not just billionaires and their mega-foundations that command attention. Record wealth inequalities might be a foe to civic comity, but they are good for philanthropy. The boom in millionaires has fueled unprecedented growth in the number and assets of small foundations as well.
So foundations have seen explosive growth. But why are they a scandal? Read the Full Article. http://www.bostonreview.net/BR38.2/ndf_rob_reich_foundations_philanthropy_democracy.php#c5t_form
My Comments:
In setting up his essay on philanthropic foundation in this “second golden age”, Reich offered the following: “Let us dismiss quickly one common and intuitive thought: that foundations exist because they are remedial or redistributive, responsive to the needs of the poor or disadvantaged.”
He goes on to identify public goods this way: “It has long been understood that the commercial marketplace does not do well at providing what economists call public goods. These are goods that, like a well-lit harbor, are available to everyone if they are available to anyone; and that, like clean air, do not cost more when they are consumed by more people. “
After three decades in the field of child welfare, this was a startling and insightful dismissal. In debating whether America’s philanthropic foundations are worthy of the tax exempt status conferred on them in 1937, Reich excludes consideration of their value relative to public services that reduce human misery but carry a cost per use. In other words Reich’s definition of public goods includes only passive public services, like street lights, but not active public services, including child welfare. This certainly explains why foundational giving for public needs is so small a percentage of their activity. Yet we are asked to judge whether their social contribution is worth their $53 billion in tax exemptions each year? How much good could that revenue do to support and strengthen our most vulnerable citizens? Don’t ask!
To characterize social services as remedial “or redistributive” of wealth, is offensive to me. When used to characterize government spending on the general welfare, “redistribution” is a code word to frame partisan arguments in our muffled debate over distributive justice. Taxing the more successful citizens to promote the general welfare, except for military spending, is considered an unfair redistribution of wealth, yet any discussion on the fair distribution of profits between workers and business owners is considered out of bounds.
The context for this discussion on foundations is the social value of philanthropy at a time when wealth disparity has never been greater. When a growing number of wealthy foundations are extracting ever more revenue from an already dwindling federal revenue stream, excluding consideration of their impact on public services makes this discussion itself a plutocratic exercise.
The pros and cons of whether foundations generate valuable diversity and innovation were well explored by the forum’s other contributors, but none of their essays addressed underlying assumptions. Foundations actually do play an outsized and often deterious role in how community social services are structured, funded and distributed. None of the contributors picked the scab off this wound to consider the broader picture. Financially speaking, foundations are in direct competition with public social services and the vulnerable populations served. I was disappointed.
