Home » Posts tagged 'Government' (Page 2)
Tag Archives: Government
A Passionate Call for an Alternative to Poliltics
What follows is the very essence of passion and disphoric expression by the next generation towards today’s intractable political systems that serve the interests of the rich and powerful. Russel Brand’s passion and rejection of establishment processes to bring about change mirror the essence of the Occupy movement. The outragiously disparate distribution of wealth and power has so distorted and hoplessly incumbered politics and democracy that he and many young people today are repulsed by it all. They struggle for an alternative that doesn’t yet exist and may never exist. The rant is perhaps a glimps into the hearts and minds of the coming generation. Through the social media an emotional consensus is building which has no clear expression or pathway to change.
Actor Russell Brand reduces BBC newsman to stunned silence with diatribe against corporate oligarchy
By Travis Gettys
Thursday, October 24, 2013
Actor and comedian Russell Brand is calling for a political and philosophical revolution in his guest editorship of the New Statesman magazine, and he explained what he wants to see in a passionately argued interview on BBC’s “Newsnight.”
Combative host Jeremy Paxson asked the British actor, who’s known for his past drug use and his brief marriage to pop singer Katy Perry, what gave him the right to promote his political beliefs, particularly since he’s never voted.
“I don’t get my authority from this preexisting paradigm, which is quite narrow and only serves a few people,” Brand said. “I look elsewhere for alternatives that might be of service to humanity.”
Ted Cruz, Money and the Power to Turn Out The Lights
Most people agree that Senator Ted Cruz, a freshman Senator from Texas, is the quartback of the federal government shutdown. He has his ideological reasons for pulling the plug, for sure, but instead of following the confusing politics behind his crazy Jihad against Obamacare, I decided to follow the money trail that backs him. Ultimate it is money, not ideology, that translates into the power to shutdown the federal government.
In the 2012 election Club for Growth and the Senate Conservative Fund were Sen. Cruz’ top two donors. These conservative fund raising groups contributed over a million dollars to his campaign.
The Senate Conservative Fund (SCF) was Cruz’ second biggest donor, contributing $385,103 to his campaign, according to OpenSecrets.org. The SCF is a leadership PAC, which means it is money raised by other politicians to support certain candidates running for office within their own party. The SCF is associated with James W. DeMint, a former South Carolina Senator and the current president of the conservative Heritage Foundation. SCF gave about $2.1 million to Republican candidates in the 2012 election cycle, which means Ted Cruz received 18% of their direct candidate support. This is significant since James DeMint has been characterized as the hidden hand behind the move to defund the Affordable Care Act (aka: Obamacare).
Club for Growth (CFG) contributed $705,657 to Ted Cruz, making them his biggest donor. That donation amounted to almost 17% of all the money CFG spent in contributions to support Republicans in the 2012 election. Only Senator Jeff Flake of Arizona received more money from CFG (one-million dollars).
But the most revealing fact about CFG’s support for Cruz is that the organization spent $4.27 million supporting a few Republican candidates while also spending a whopping $10 million (in outside spending) to oppose other Republican candidates. In other words CFG is like a wrecking ball destroying fellow Republican candidates who don’t meet their conservative standards.
I tried to learn where CFG gets its money, but this is difficult because it is a “527” organization, a 501(c)4 not for profit, that is allowed to collect unlimited contributions. CFG doesn’t have to disclose its donors or reveal its activity. According to a February, 2011 article by John Nichols of The Nation, The Club for Growth is “an organization funded by extremely wealthy conservatives to carry out their budget-stripping goals.”
What seems to emerge from this view of the government shutdown is a tectonic rift in the financial power base underneath the Republican party. Well organized and well funded sources of money are narrowly targeting resources to heavily fund a select few candidates while, in the case of Club for Growth, using resources to undermine Republican candidates who are less ideologically pure. Indeed, Club for Growth uses its club to cull the herd, a development that has no equal in Democratic politics.
Up until now the Senate and House Majority Leaders held all the purse strings of power to punish or reward members of their party. Not so any more. Ted Cruz does not stand alone when he defies his Republican colleagues in the Senate, as pundits have suggested. Rather, he is the tip of an iceberg around which his caucus has to navigate. He is able to side steps House Speaker John Beohner and whips support for defunding Obamacare in the House because he carries with him both a carrot and a club.
It is difficult to work out all the implications that may result from this rift in the fabric of Republican politics, but over the short term it can’t be very good. The rift is just the public view of a subsurface divide between the wealthy elite who are the titians of power in America. It isn’t clear, to me, exactly what is at play. What are the control points that one group seeks over the other and what would be the gain? Intrigue at that level of play is heavily cloaked in secrecy. For now, all we can do is to try and read the tea leaves.
The Dark Side of Saudi Petro-dollars
Did you know that the Syrian government has agreed to send peace envoys to Geneva? According to Robert Parry at Consortium News, the problem is that the rebels have refused to negotiate. Some rebel groups are insisting on a long list of unacceptable preconditions. On the surface, according to Parry, ” The real problem seems to be how divided the Syrian opposition is, with schisms from pro-democracy moderates to violent jihadists including some who film themselves eating the internal organs of dead Syrian soldiers and executing defenseless captives. ” But the underlying problem is actually, “… the obstruction from al-Qaeda-connected jihadists who are beholden for their military and financial support to Saudi Arabia and other oil sheikdoms operating under Saudi Arabia’s political/diplomatic wing.” Consortiumnew – http://j.mp/1gWqrfv

Photo: http://thinkprogress.org/economy/2010/01/13/76933/foreign-oil-tea/
The scope and depravity of Saudi sponsored violence in the world is enormous and yet hard to spot. It surfaced on July 31st in Moscow when Prince Bandar in a meeting with Russian President Vladimir Putin, offered to protect next year’s Winter Olympics in Sochi from terrorist attack if Russia agreed to end support for Bashar al-Assad in Syria. The offer by Bandar came with inducements as well. What amounted to a diplomatic shake down angered Putin, who believes that Saudi oil money is already helping to finance Chechnyan terrorist that target innocent Russian civilians. http://j.mp/14DEu7w
Saudi oil money seems to turn up in many places where terrorist violence stains the ground with blood from innocent civilians. In a recent piece in the Vancouver Sun, Jonathan Manthrope wrote: “The ultimate responsibility for recent atrocities like the Boston Marathon bombing and the butchering last week of an off-duty British soldier is very clear. It belongs to Saudi Arabia. Over more than two decades, Saudi Arabia has lavished around $100 billion or more on the worldwide promotion of the violent, intolerant and crudely puritanical Wahhabist sect of Islam that the ruling royal family espouses. http://j.mp/1b26280
Saudi Arabian petro dollars are bankrolling global terrorism, but the actual funding transactions within the country are complex, filled with shadowy connections and courtyard intrigue. The following diplomatic cable obtained and released by Wikileaks provide a glimpse of the inside game:
:… one leaked cable sent by U.S. Secretary of State Hillary Clinton in December 2009 noted that “it has been an ongoing challenge to persuade Saudi officials to treat terrorist financing emanating from Saudi Arabia as a strategic priority.” It adds: “Donors in Saudi Arabia constitute the most significant source of funding to Sunni terrorist groups worldwide” — running into millions of dollars. “Riyadh has taken only limited action to disrupt fundraising for the UN 1267-listed Taliban and LeT-groups that are also aligned with al-Qaeda,” the cable from Clinton says.” CNN – http://j.mp/1fy6RIP
The record of Saudi funded global terrorism is clear even if it isn’t well publicized in the press. The strategic importance of Saudi Arabia for US interests in the region is hard to overstate. And then there are the political connections between Prince Bantar and moneyed interests here and abroad, including a long friendship with the Bush family. The Syrian sponsored news organizations portray the Bush family connection in an extreme and self-serving conspiratorial way. http://j.mp/14DHhgM
It doesn’t require a conspiratorial mentality to see that Saudi Arabia is complicit in supporting global terrorism. They are dealing from both sides of the deck. Even so the Saudi’s receive special treatment from the US and our allies. It is time for a clear-eyed reassessment of our relationships. If we want the global bloodshed to end and diplomacy to succeed in the world, the Saudi regime must terminate it’s financial support for global terror.
Abe Lincoln on Corporate Corruption
What Lincoln Foresaw:
Corporations Being “Enthroned” After the Civil War
and Re-Writing the Laws Defining Their Existence
by Rick Crawford, crawford@cs.ucdavis.edu
|
Here is a sobering quote by Abe Lincoln:
Some people expressed doubts about its authenticity, given Lincoln’s work as an attorney for railroad corporations! It was an interesting job tracking it down and verifying its authenticity.
The passage appears in a letter from Lincoln to (Col.) William F. Elkins, Nov. 21, 1864.
In several books, I found numerous places where Lincoln spoke about Capital and Labor (“Workingmen”). Lincoln re-used his own material frequently, and virtually identical passages appear in several places. Lincoln praises the moral rightness ofboth Capital and Labor, but this is invariably in the context of a nation where NO MORE THAN ONE MAN IN EIGHT is a Capitalist or a Laborer, ie, where 7/8 of the population are “self-employed” on their own farms and homesteads.
|
DOJ Let’s Halliburton off the Hook for Destroying Gulf Oil Spill Evidence
It seems possible that Halliburton Energy Services didn’t what it’s three-dimensional computer simulations of what when wrong in the Macondo Well blow-out to get into the hands of federal prosecutors. The simulations were destroyed and the DOJ filed criminal charges against Halliburton for this destruction of evidence. Halliburton was subsequently allowed to settle the charges of destroying evidence with the DOJ, pleading to just one count. Sen. John McCain is among those who feel that justice was not being served here. The following excerpt is from E&E News. A link to the full article is found below as is a PDF copy of Sen. McCain’s letter.
Republican questions Halliburton’s Gulf spill settlement
Jeremy P. Jacobs, E&E reporter
Published: Thursday, August 1, 2013
http://www.eenews.net/special_reports/gulf_spill/stories/1059985487
Arizona Sen. John McCain today expressed deep concerns about the Department of Justice’s recent settlement with Halliburton Energy Services Inc. over the destruction of evidence following the 2010 Deepwater Horizon oil spill.
The Republican asked DOJ several questions about how the $200,000 settlement came about and whether it is sufficient given the nature of the allegations. [SNIP]
Halliburton admitted to one count of destroying evidence and agreed to pay the maximum statutory penalty of $200,000. Additionally, Halliburton faces three years of probation and has agreed to cooperate with DOJ’s ongoing investigation into the Gulf of Mexico explosion and spill that killed 11 rig workers.
The settlement stems from three-dimensional computer simulations that Halliburton ran after the blowout on the Macondo well. Engineers were trying to determine whether BP PLC’s decision to use fewer centralizers around the well’s casings than Halliburton had recommended may have caused the blowout. [SNIP]
“Why did DOJ settle this case for such a relatively small fine rather than choose to prosecute Halliburton to the full extent of its culpability in the Deepwater Horizon disaster?” McCain asked.
McCain also raised questions about Halliburton’s decision to contribute $55 million to the National Fish and Wildlife Foundation separate from the settlement.
Read John McCain’s Letter Here: http://www.eenews.net/assets/2013/08/01/document_pm_01.pdf
NSA Data Collection Can’t Be Made Safe
President Obama said, ” Between all the safeguards and checks that we put in place within the executive branch, and the federal court oversight that takes place on the program, and congressional oversight, people are still concerned as to whether their emails are being read or their phone calls are being listened to.”

Wrong premise, Mr. President! I am upset because a government program directs that my emails and phone calls be collected and stored somewhere. Whether the government ever reviews them is beside the point. The whole concept of the NSA’s data collection ideology is unconstitutional. For government to collect private communications is a criminal act, one the United States would have forcefully condemned if this had taken place in the former Soviet Union.
Sending emails or placing calls isn’t like putting out the trash. I willingly release my garbage to the public streets. Any passerby can grab it, so I have a diminished expectation of privacy. This isn’t true of my personal communications. My neighbors can’t read every email I send. I do expect that personal communications are not in public view. But even if the government required trash haulers to catalogue and save the contents if my garbage it would be an outrage.
Governments need systems of checks and balances more robust than then the character of those who administer them. The mass collection of domestic communications by or for the NSA already crosses the line, so no safeguards or checks can make it safe or acceptable.
Helen Thomas – R.I.P.
A wonderful person and a journalist of historic significance
It is sad to read of Helen Thomas’ passing. She lead an exemplary life as a journalist and a woman. She has had a very positive impact on journalism. The nation’s history during her time with us is a bit more honest and open because of her. She asked the tough questions that her male colleagues didn’t think or dare to ask. Presidents were forced to anticipate her questions when planning what to say. Which Washington pool reporter today has that impact on the White House?
Ms. Thomas would find it a fitting tribute if in reviewing her life, career, and her impeachable integrity as a journalist, that we use her example to deepen our examination of journalism as it is practiced today. This is especially opportune at a time when whistle blowers are pursued as traitors, telephones at news agencies are bugged and journalists turn on their own for printing what every American has a right to know about what government is doing. I hope some of the young journalists coming up today will take some lessons from Helen Thomas and show the courage that she displayed over her career. And I hope that news organizations find the courage to challenge their corporate over lords and empower journalists to uncover what is true and important for the rest of us know.
On a more personal note, while I never met Ms. Thomas, she was very kind and welcoming to two young journalists in my familly when they first arrived in Washington. She was, and remains an inspiration for many. Knowing how much I admired her my family gave me a copy of her book, “Watchdogs of Democracy” which she very kindly signed for me. Thank you, Helen.
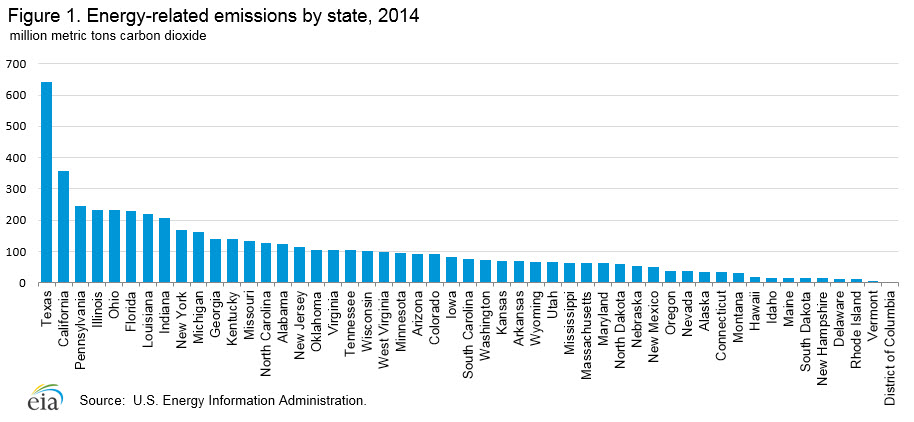
Texas, Where Carbon is King
Take one look at the state-by-state CO2 admission rates and it is immediately apparent that two states stand out from the rest, California and Texas. Of these two, Texas stands head and shoulders over California. Over the span of ten years Texas produced over 7.5 trillion metric tons of CO2, That is more than the 19 lowest emissions states plus D.C. combined. Amost 12% of al the CO2 emissions generated in the United States came from Texas. Californai produced 6.6% while Pensyulvania, Ohio, Florida and Illinois each produce between 4.6% and 4% of the nations CO2 emissions.
What are the implications for carbon conservation when more than one-sixth (18.3%) of all CO2 emissions are coming from just two states? For one thing it suggests that focusing national efforts on Texas and California can produce the biggest improvements in the short term. Furthermore, the data suggests that half the states with the lowest emissions are already working harder to reduce further carbon emissions that higher CO2 producing states. Among the higher CO2 producing states, Florida, Georga, Kentucky, Missouri, Oklahoma, Arizona, Colorodo and South Carolina increased their carbon polution between 2000 and 2010. Of these, the states with the highest rate of increase were Arazona (9.9%) and Colorado (11.8%). The largest state increase in carbon emissions over ten years was Nabraska (16.0%). So focusing our national effort on just a hand full of states might be the best strategy to make the biggest and quickest improvements in our carbon footprint in the world.
US ENERGY INFORMATION ADMINISTRATION
http://www.eia.gov/environment/emissions/state/analysis/
Release Date: May 13, 2013 | Next Release Date: May 2014 | full report State-Level Energy-Related Carbon Dioxide Emissions, 2000-2010
| Table 1. State energy-related carbon dioxide emissions by year (2000 – 2010) | ||||||||||||||
| million metric tons carbon dioxide | ||||||||||||||
| Change | ||||||||||||||
| 2000 to 2010 | ||||||||||||||
| State | 2000 | 2001 | 2002 | 2003 | 2004 | 2005 | 2006 | 2007 | 2008 | 2009 | 2010 | Percent | Absolute | |
| District of Columbia | 4.3 | 4.1 | 4.2 | 3.9 | 4.0 | 3.9 | 3.2 | 3.4 | 3.1 | 3.2 | 3.3 | -23.6% | -1.0 | 40.6 |
| Vermont | 6.8 | 6.6 | 6.4 | 6.5 | 7.0 | 6.8 | 6.7 | 6.6 | 6.1 | 6.3 | 6.0 | -10.8% | -0.7 | 71.9 |
| Rhode Island | 11.6 | 12.1 | 11.6 | 11.3 | 10.8 | 11.0 | 10.4 | 11.0 | 10.6 | 11.3 | 11.0 | -4.8% | -0.6 | 122.6 |
| South Dakota | 14.1 | 13.4 | 13.7 | 13.6 | 13.7 | 13.2 | 13.3 | 13.9 | 15.1 | 14.9 | 15.1 | 7.3% | 1.0 | 154.1 |
| Delaware | 16.3 | 15.7 | 15.5 | 16.1 | 16.1 | 17.0 | 15.8 | 16.7 | 15.9 | 11.8 | 11.7 | -27.9% | -4.5 | 168.7 |
| Idaho | 15.6 | 15.5 | 14.9 | 14.2 | 15.5 | 15.7 | 15.8 | 16.3 | 15.8 | 15.4 | 16.2 | 4.0% | 0.6 | 170.9 |
| New Hampshire | 17.5 | 16.9 | 17.6 | 20.8 | 21.9 | 21.3 | 19.4 | 19.3 | 19.1 | 17.3 | 17.0 | -2.8% | -0.5 | 208.0 |
| Hawaii | 18.8 | 19.2 | 20.5 | 21.5 | 22.6 | 23.2 | 23.5 | 24.4 | 19.7 | 18.9 | 18.9 | 0.7% | 0.1 | 231.1 |
| Maine | 22.3 | 22.4 | 24.0 | 23.4 | 24.0 | 23.1 | 21.3 | 21.0 | 19.4 | 18.6 | 18.5 | -17.1% | -3.8 | 238.1 |
| Montana | 31.3 | 31.9 | 30.7 | 32.7 | 34.5 | 35.5 | 35.8 | 37.8 | 36.1 | 32.5 | 34.9 | 11.4% | 3.6 | 373.6 |
| Connecticut | 42.8 | 41.5 | 39.9 | 42.3 | 44.4 | 43.9 | 40.9 | 40.3 | 38.2 | 36.5 | 36.9 | -13.7% | -5.8 | 447.7 |
| Oregon | 41.2 | 40.6 | 39.1 | 39.3 | 40.6 | 41.0 | 40.3 | 43.8 | 43.2 | 41.2 | 40.3 | -2.4% | -1.0 | 450.6 |
| Nevada | 45.3 | 44.6 | 41.4 | 43.4 | 47.7 | 49.8 | 41.5 | 41.8 | 41.2 | 39.7 | 38.1 | -15.9% | -7.2 | 474.3 |
| Alaska | 44.3 | 43.4 | 43.6 | 43.5 | 46.8 | 48.1 | 45.8 | 44.1 | 39.5 | 37.9 | 38.7 | -12.6% | -5.6 | 475.6 |
| Nebraska | 41.4 | 42.7 | 42.2 | 43.0 | 43.1 | 43.5 | 44.1 | 44.5 | 46.5 | 46.8 | 48.0 | 16.0% | 6.6 | 485.7 |
| North Dakota | 50.8 | 51.7 | 51.4 | 50.9 | 49.5 | 52.4 | 50.8 | 52.6 | 53.1 | 51.4 | 52.5 | 3.3% | 1.7 | 567.1 |
| New Mexico | 58.0 | 58.2 | 55.2 | 57.3 | 58.5 | 59.1 | 59.9 | 59.1 | 57.6 | 58.5 | 54.8 | -5.5% | -3.2 | 636.2 |
| Arkansas | 63.2 | 62.4 | 60.9 | 61.3 | 61.9 | 59.7 | 61.6 | 63.1 | 63.7 | 61.6 | 66.1 | 4.6% | 2.9 | 685.8 |
| Wyoming | 62.7 | 63.0 | 61.7 | 63.4 | 63.4 | 62.8 | 63.7 | 66.1 | 66.8 | 63.7 | 64.9 | 3.5% | 2.2 | 702.3 |
| Mississippi | 60.6 | 69.4 | 61.9 | 63.2 | 64.8 | 63.2 | 65.4 | 67.7 | 64.1 | 60.4 | 65.5 | 8.0% | 4.9 | 706.1 |
| Utah | 65.1 | 62.9 | 62.1 | 62.7 | 65.3 | 67.0 | 68.3 | 70.4 | 69.9 | 65.0 | 64.2 | -1.3% | -0.9 | 723.0 |
| Kansas | 76.1 | 71.8 | 76.6 | 78.4 | 75.8 | 72.0 | 72.1 | 80.1 | 76.9 | 75.0 | 75.0 | -1.3% | -1.0 | 829.7 |
| Maryland | 77.5 | 78.0 | 77.9 | 80.4 | 82.0 | 83.9 | 77.5 | 78.1 | 74.7 | 71.4 | 70.5 | -9.0% | -7.0 | 852.0 |
| Washington | 82.8 | 79.4 | 72.8 | 74.5 | 76.7 | 78.3 | 76.3 | 81.8 | 79.6 | 77.5 | 76.1 | -8.1% | -6.7 | 855.9 |
| Massachusetts | 82.2 | 82.1 | 82.9 | 83.8 | 82.6 | 84.3 | 76.4 | 80.0 | 77.2 | 71.0 | 73.0 | -11.2% | -9.2 | 875.6 |
| Iowa | 77.7 | 76.6 | 77.2 | 76.4 | 78.9 | 78.9 | 80.2 | 85.7 | 88.3 | 83.8 | 88.7 | 14.1% | 11.0 | 892.4 |
| South Carolina | 79.3 | 78.0 | 79.2 | 79.5 | 87.1 | 85.7 | 86.4 | 87.0 | 85.5 | 80.7 | 84.0 | 5.9% | 4.7 | 912.5 |
| Colorado | 84.7 | 92.8 | 90.9 | 90.0 | 93.1 | 95.4 | 96.4 | 99.2 | 97.6 | 93.7 | 96.5 | 13.9% | 11.8 | 1,030.3 |
| Arizona | 86.0 | 88.3 | 87.7 | 89.3 | 96.6 | 96.7 | 100.0 | 102.2 | 103.1 | 94.6 | 95.9 | 11.6% | 9.9 | 1,040.5 |
| Minnesota | 97.7 | 94.7 | 97.3 | 101.0 | 100.6 | 101.7 | 99.1 | 100.9 | 100.6 | 93.1 | 93.4 | -4.4% | -4.3 | 1,080.3 |
| Wisconsin | 107.5 | 105.5 | 106.7 | 104.3 | 107.1 | 110.5 | 102.7 | 104.7 | 105.7 | 96.7 | 99.2 | -7.7% | -8.3 | 1,150.6 |
| Oklahoma | 100.1 | 101.4 | 101.6 | 103.5 | 99.8 | 106.9 | 110.2 | 109.6 | 113.1 | 104.9 | 103.4 | 3.4% | 3.4 | 1,154.5 |
| West Virginia | 113.4 | 103.5 | 116.2 | 112.5 | 109.8 | 111.9 | 112.2 | 114.6 | 110.6 | 89.1 | 98.9 | -12.7% | -14.4 | 1,192.8 |
| Virginia | 122.3 | 120.0 | 118.5 | 122.2 | 126.5 | 128.5 | 122.0 | 127.7 | 117.4 | 106.3 | 109.8 | -10.2% | -12.5 | 1,321.3 |
| Tennessee | 125.2 | 124.2 | 123.2 | 120.9 | 123.0 | 124.6 | 127.0 | 126.7 | 120.3 | 100.3 | 107.1 | -14.5% | -18.1 | 1,322.4 |
| New Jersey | 121.1 | 118.5 | 118.9 | 119.8 | 122.6 | 127.6 | 120.2 | 128.6 | 124.3 | 110.4 | 115.4 | -4.7% | -5.7 | 1,327.5 |
| Missouri | 125.4 | 131.1 | 131.8 | 138.3 | 140.0 | 143.0 | 141.6 | 140.8 | 137.9 | 131.6 | 135.7 | 8.2% | 10.3 | 1,497.2 |
| Alabama | 140.4 | 132.0 | 136.7 | 137.2 | 139.7 | 141.5 | 144.0 | 146.1 | 139.2 | 119.8 | 132.7 | -5.5% | -7.7 | 1,509.3 |
| North Carolina | 147.7 | 143.1 | 144.3 | 144.7 | 148.2 | 152.7 | 147.4 | 153.6 | 149.0 | 132.9 | 142.9 | -3.3% | -4.8 | 1,606.4 |
| Kentucky | 144.7 | 148.1 | 148.3 | 143.9 | 150.9 | 153.2 | 156.1 | 156.4 | 153.7 | 143.7 | 150.7 | 4.2% | 6.1 | 1,649.7 |
| Georgia | 167.9 | 160.3 | 165.1 | 167.5 | 173.3 | 183.9 | 181.5 | 184.6 | 173.5 | 163.4 | 173.7 | 3.4% | 5.8 | 1,894.7 |
| Michigan | 192.6 | 188.5 | 187.9 | 184.7 | 187.4 | 189.3 | 178.2 | 181.2 | 175.2 | 164.4 | 165.9 | -13.9% | -26.7 | 1,995.1 |
| New York | 211.4 | 206.7 | 200.8 | 210.1 | 213.9 | 210.7 | 192.5 | 199.4 | 190.5 | 175.5 | 172.8 | -18.3% | -38.6 | 2,184.4 |
| Louisiana | 239.9 | 211.9 | 219.8 | 214.6 | 226.2 | 221.7 | 236.0 | 234.5 | 221.7 | 203.9 | 223.5 | -6.8% | -16.4 | 2,453.6 |
| Indiana | 238.2 | 228.6 | 231.7 | 236.9 | 237.8 | 236.7 | 235.0 | 234.7 | 231.5 | 208.5 | 219.1 | -8.0% | -19.1 | 2,538.6 |
| Illinois | 232.1 | 223.1 | 225.1 | 227.7 | 235.2 | 242.0 | 233.9 | 242.1 | 240.7 | 226.1 | 230.4 | -0.7% | -1.7 | 2,558.3 |
| Florida | 239.2 | 238.1 | 241.3 | 244.9 | 257.3 | 260.9 | 259.5 | 257.8 | 240.2 | 226.3 | 246.0 | 2.8% | 6.7 | 2,711.7 |
| Ohio | 264.0 | 254.5 | 260.3 | 267.4 | 262.5 | 269.7 | 263.0 | 268.9 | 261.9 | 237.6 | 249.1 | -5.6% | -14.9 | 2,858.9 |
| Pennsylvania | 276.3 | 263.4 | 270.1 | 273.0 | 276.6 | 280.0 | 274.1 | 277.6 | 264.9 | 246.0 | 256.6 | -7.1% | -19.7 | 2,958.7 |
| California | 381.3 | 385.8 | 384.9 | 389.5 | 391.5 | 389.0 | 397.5 | 403.7 | 389.8 | 375.9 | 369.8 | -3.0% | -11.4 | 4,258.6 |
| Texas | 711.3 | 704.1 | 715.8 | 706.4 | 709.7 | 677.8 | 675.2 | 676.7 | 653.3 | 624.9 | 652.6 | -8.3% | -58.8 | 7,507.7 |
| Total1 | 5,879.9 | 5,772.4 | 5,810.0 | 5,857.5 | 5,968.8 | 6,000.4 | 5,921.6 | 6,029.0 | 5,842.9 | 5,441.8 | 5,631.3 | -4.2% | -248.6 | 64,155.6 |
| 1For the United States as a country see, EIA, Monthly Energy Review, Section 12: Environment. Differing methodologies between the two data series causes | ||||||||||||||
| the total for all states to be slightly different from the national-level estimate. The amount varies no more than 0.5 percent. See Appendix A for details on | ||||||||||||||
| the data series differences. | ||||||||||||||
| Source: U.S. Energy Information Administration (EIA), State Energy Data System and EIA calculations made for this analysis. | ||||||||||||||
| Note: The District of Columbia is included in the data tables, but not in the analysis as it is not a state. | ||||||||||||||
Lobbying Produced a 22,000% Return for Corporations per One Study
Is lobbying Congress a good investment?
This is normally a nearly impossible question to answer, but a unique set of circumstances allowed researchers to conclude that Corporate lobbying for a tax amnesty provision in the 2004 American Jobs Creation Act(AJCA) yielded a 22,000% return. Yea, I would say it was worth it.
One reason why the question can’t normally be answered is that the financial information needed to answer the question can almost only be found on Corporate tax returns. All tax returns are confidential and only the IRS can see them. But a unique opportunity to study this question presented itself through a tax amnesty provision in the AJCA.
The University of Kansas School of Business ceased the opportunity. Researchers found that they were able, in this unique situation, to publicly obtain all the information need to analyze the return on lobbying expenditures. As stated in this study, “This is the first study to provide actual values of the financial savings arising from tax law changes, and the first to use data that has been audited by independent accounting firms.”
Cudos to the authors, Alexander, Mazza and Scholtz, and to the University of Kansas School of Business for this important piece of research.
Measuring Rates of Return for Lobbying Expenditures: An Empirical Analysis under the American Jobs Creation Act
Raquel Meyer Alexander
University of Kansas – School of Business
Stephen W. Mazza
University of Kansas – School of Law
Susan Scholz
University of Kansas – Accounting and Information Systems Area
April 8, 2009
Abstract:
The lobbying industry has experienced exponential growth within the past decade. The general public, the media, and special interest groups perceive lobbying to be a powerful mechanism affecting public policy. However, academic research finds inconclusive results when quantifying the rate of return on political lobbying expenditures. In this paper we use audited corporate tax disclosures relating to a tax holiday on repatriated earnings created by the American Jobs Creation Act of 2004 to examine the return on lobbying. We find firms lobbying for this provision have a return in excess of $220 for every $1 spent on lobbying, or 22,000%. Repatriating firms are more profitable overall, but surprisingly, profitability is not a predictor of repatriation amount. Rather, industry and firm size are most predictive of repatriation. Cash on hand, a proxy for ability to repatriate, is not associated with the repatriation decision or the repatriation amount. This paper provides compelling evidence that lobbying expenditures have a positive and significant return on investment.
Working Paper Series
GO TO THE WEBSITE AND DOWNLOAD THE FULL REPORT HERE http://bit.ly/Abj1Or
From the report:
|
[Top 20] Companies Repatriating $500M or More
(105 companies total1)
|
||||
|
Amount
|
Amount Repatriated/
|
|||
|
Rank
|
Company
|
Repatriated
|
Total Assets2
|
Revenue2
|
|
1
|
PFIZER
|
37,000
|
30%
|
70%
|
|
2
|
MERCK & CO
|
15,900
|
37%
|
68%
|
|
3
|
HEWLETT PACKARD
|
14,500
|
19%
|
18%
|
|
4
|
JOHNSON & JOHNSON
|
10,800
|
20%
|
23%
|
|
5
|
IBM
|
9,500
|
9%
|
10%
|
|
6
|
SCHERING-PLOUGH
|
9,400
|
59%
|
114%
|
|
7
|
DU PONT
|
9,100
|
26%
|
33%
|
|
8
|
BRISTOL-MYERS SQUIBB
|
9,000
|
30%
|
46%
|
|
9
|
ELI LILLY & CO
|
8,000
|
32%
|
58%
|
|
10
|
PEPSICO
|
7,500
|
27%
|
26%
|
|
11
|
PROCTOR & GAMBLE
|
7,200
|
13%
|
14%
|
|
12
|
INTEL
|
6,200
|
13%
|
18%
|
|
13
|
COCA-COLA
|
6,100
|
19%
|
28%
|
|
14
|
ALTRIA GROUP
|
6,000
|
6%
|
9%
|
|
15
|
MOTOROLA
|
4,600
|
15%
|
15%
|
|
16
|
DELL
|
4,100
|
18%
|
8%
|
|
17
|
MORGAN STANLEY
|
4,000
|
1%
|
10%
|
|
18
|
CITIGROUP
|
3,200
|
0%
|
3%
|
|
19
|
ORACLE
|
3,100
|
15%
|
26%
|
|
19
|
WYETH
|
3,100
|
9%
|
18%
|
Micro Drones and the Future of Spying
Unlike the current unconstitutional practice of scooping up every phone call made in the US, at least a swarm of micro drones would need to have a specific target for their spying and reconnaissance work. This story brings new meaning to the expression, “I’m being bugged!”
US military surveillance future: Drones now come in swarms?

A small insect or a mosquito over your ear may now be much more than simply annoying. Those could easily be micro drones which now come in a swarm of bug-sized flying spies.
In an effort to create a hard-to-detect surveillance drone that will operate with little or no direct human supervision in out of the way and adverse environments, researchers are mimicking nature.
The University of Pennsylvania GRASP Lab showed off a network of 20 nano-quad rotors capable of agile flight, which could swarm and navigate in an environment with obstacles.
This is another step away from bulky heavily armed aerial vehicles or humanoid robots to a much smaller level of tiny remote-control devices. While current drones lack manoeuvrability, can’t hover and move fast enough, these new devices will be able to land precisely and fly off again at speed. One day the military hope they may prove a crucial tactical advantage in wars and could even save lives in disasters. They can also be helpful inside caves and barricaded rooms to send back real-time intelligence about the people and weapons inside.
A report in NetworkWorld online news suggests the research is based on the mechanics of insects, which potentially can be reverse-engineered to design midget machines to scout battlefields and search for victims trapped in rubble.
In an attempt to create such a device, scientists have turned to flying creatures long ago, examining their perfect conditions for flight, which have evolved over millions of years.
Zoologist Richard Bomphrey has told the British Daily Mail newspaper he has conducted research to generate new insight into how insect wings have evolved over the last 350 million years.
“By learning those lessons, our findings will make it possible to aerodynamically engineer a new breed of surveillance vehicles that, because they are as small as insects and also fly like them, completely blend into their surroundings,”the newspaper quotes him as saying.
The US Department of Defense has turned its attention to miniature drones, or micro air vehicles long ago.

Image from video of a swarm of Nano Qardrotors, posted at GRASP Laboratory website
As early as in 2007 the US government was accused of secretly developing robotic insect spies when anti-war protesters in the US saw some flying objects similar to dragonflies or little helicopters hovering above them. No government agency has admitted to developing insect-size spy drones though some official and private organizations have admitted that they were trying.
In 2008, the US Air Force showed off bug-sized spies as “tiny as bumblebees” that would not be detected when flying into buildings to “photograph, record, and even attack insurgents and terrorists.”
The same year US government’s military research agency (DARPA) conducted a symposium discussing ‘bugs, bots, borgs and bio-weapons.’
Around the same time the so-called Ornithopter flying machine based on Leonardo Da Vinci’s designs was unveiled and claimed they would be ready for roll out by 2015
Lockheed Martin’s Intelligent Robotics Laboratories unveiled “maple-seed-like” drones called Samarai that also mimic nature. US troops could throw them like a boomerang to see real-time images of what’s around the next corner.
The US is not alone in miniaturizing drones that imitate nature: France, the Netherlands and Israel are also developing similar devices.

An image from NetworkWorld.com
