Home » Posts tagged 'Middle Class'
Tag Archives: Middle Class
A Best of Times, Worst of Times Economy
by Brian T. Lynch, MSW
The impact on the economy of stagnant wages is ever slower consumption of goods and services over time. There isn’t as much money to buy things. This slower rate of consumption suppresses demand. Lower demand means fewer jobs and even lower wages for the rest of us. This is the cycle were we find ourselves today.
The consumption of goods produces the profits from with owners of capital collect returns on their investments. Lower demand due to suppressed wages would normally also lower returns on capital investments but for the factors that have kept consumption afloat. Now there are no hours left in a day, fewer household members available to work, no more capacity to borrow against future earnings. Now the impact of low wages has come home to roost and lower sales means less profit to be made.
Before the 1970’s this situation would right itself when owners shared a portion of their wealth by offering productivity raises to reward their workers. Productivity wages are based on growing productivity and are separate and above cost of living increases. Productivity raises, along with cost of living adjustments, allowed the labor/consumers to increase spending and boost demand. Increased demand would spur on manufacturing and stimulate the whole economy.
But today’s billionaires have found another way to profit without sharing their wealth with wage earning consumers. They spotted the growing ownership stake of many in the middle class and created an opportunity to take it all back. It is hard for most of us to see in our lifetime, but this is the first time in history of the world that the middle class (upper-middle mostly) has accumulated a significant stake in capital ownership. Many of us have retirement accounts, money market funds, etc. People in the upper-middle class, doctors, lawyers, middle-managers etc., have become mini-investment capitalists. Prior to the vast destruction of property caused by the world wars in the last century, wealth was concentrated at the top as is happening again today. Middle class gains in the 20th Century directly correspond to capital losses by the wealthiest owners during the two world wars.
Billionaire capitalists, the “true heirs” to wealth ownership, have responded to middle-class ownership of capital by creating a massive financial investment casino filled with elaborate new investment vehicles. The object is to entice new wealth owners to play in the billionaire’s casinos. Mortgage backed securities and swaps are just two small examples that nearly bankrupted the economy in 2008.
These new and incomprehensible investment products has spawned a whole new class of hucksters, like Bernie Madoff, who use these bewildering new instruments to create slick ponzi schemes. But the bulk of these new investment opportunities are just a big casino games in which the house (billionaire owners) always wins. Billionaires are quickly siphoning away middle class ownership stakes in capital through high finance games of chance. In this way they can boost returns on investments and entertain themselves without sharing their wealth through higher wages.
Because these billionaire owners, who make up less than .01% of the population, control the investment odds, they are sure to win back all the capital they lost in the war years of the last century. Middle class gains in the 20th Century correspond to capital losses by the wealthiest owners during the two world wars. This now explains why the stock market and investment economy seem to be booming while the economy on Main Street slumps. Billionaire capitalists don’t have to share wealth to make wealth like they use to. There are enough small investors with an ownership stake willing to gamble what little they have in this new investment casino to keep billionaire fortunes growing.
If you, the reader, are still with me at this point let me assure you that the geometrically rising gains by the wealthiest owners of capital are not an inevitability. There are difficult but concrete steps we can take to bring capitalism back into balance for everyone. A discussion of these solutions does require a much deeper understanding of problems that I can provide here. I firmly believe it is in our best interest to arm ourselves with a much better understanding of the forces creating our two economies; Forces that are threatening our democratic institutions. For a fuller understanding I recommend Thomas Piketty’s excellent book, Capitalism in the 21st Century. I encourage you to strike up conversations with others and share your thoughts and questions.
Prologue To Wealth Inequality Awarness
By Brian T. Lynch, MSW
Before I had a blog, before the Wall Street “privateers of equity” crashed the economy, and long before the Occupy movement occupied anything, there were seemingly crazy folks like me trying to sound the alarm on our economy. I wrote Letters to the Editor in local newspapers and sent copies to every newspapers across the country for which I had an email addresses. What disturbed me back then was that no one in the media, or even in academia, seemed to be paying much attention. Event have consequences, and the crash in 2008 caught us flat footed.
It is unknown how social problems that exist for years suddenly become public issues to be solved. No one knows what triggers these tipping points. Even when a single individual is clearly associated with a change or a movement or a discovery (Einstein, for example), that person is responding to what ever came before. Sometime it is the consequential event rather than any alarm bells that finally get our attention. The firmament that precedes public cognition before a disastrous event remains a mystery to me.
My wife just came across one of my old letters. What startled me is that I could have written this same letter today, except the statistics are far worse now.
Here below is my Daily Record Letter to the Editor published on Christmas Eve, 2006.

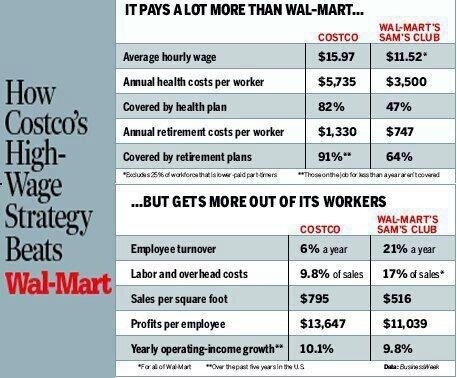
Higher Wages – Good for Families, Good for Economy & Good for Business
Below is another graphic that speaks for itself. Not only does paying higher wages improve the US economy and the lives of every citizen, it also makes good business sense.
I have written extensively on wage history and the case for a living wage, wealth distribution in America, our global business competitiveness, the dangers of our growing wealth inequality, and many other issues effecting middle and working class Americans, including and post on class warfare.
In a Labor Day message from former Secretary of Labor, Robert Reich, he, ” breaks down what it’ll take for workers to get a fair share in this economy — including big, profitable corporations like McDonald’s and Walmart to pony up and finally pay fair wages.
There is a petition that you can sign if you click on the above link. Please consider it your Labor Day obligation to those who struggled and even died to give you the benefits we still have today.
See How Much Money it Takes to Be Financially Secure in Your Town
What follows is a Family Budge Calculator put out by the Economic Policy Institute. www.epi.org/resources/budget/ The example shown here is for a two parent family with two children living in the capital city of New Jersey, Trenton. A typical family there needs over $75,000 in income per year to be financially secure. That means each parent would have to work full-time and be making at least $18/hour. Or, if only one parent worked, they would need to be pulling in $36/hour for their family to be financially secure. This is a long ways from minimum wage.
Family Budget Calculator
EPI’s Family Budget Calculator measures the income a family needs in order to attain a secure yet modest living standard by estimating community-specific costs of housing, food, child care, transportation, health care, other necessities, and taxes. The budgets, updated for 2013, are calculated for 615 U.S. communities and six family types (either one or two parents with one, two, or three children).
As compared with official poverty thresholds such as the federal poverty line and Supplemental Poverty Measure, EPI’s family budgets offer a higher degree of geographic customization and provide a more accurate measure of economic security. In all cases, they show families need more than twice the amount of the federal poverty line to get by. [To see and use the actual calculator for yourself readers of WordPress must go to the website at http://www.epi.org/resources/budget/ ]
Family Types include:
One Parent, One Child One Parent, Two Children One Parent, Three Children Two Parents, One Child Two Parents, Two Children Two Parents, Three Children
States Include:
AK AL AR AZ CA CO CT DC DE FL GA HI IA ID IL IN KS KY LA MA MD ME MI MN MO MS MT NC ND NE NH NJ NM NV NY OH OK OR PA RI SC SD TN TX UT VA VT WA WI WV WY
Area Names In New Jersey Include:
Atlantic City, NJ MSA Bergen-Passaic, NJ HUD Metro FMR Area Jersey City, NJ HUD Metro FMR Area Middlesex-Somerset-Hunterdon, NJ HUD Metro FMR Area Monmouth-Ocean, NJ HUD Metro FMR Area Newark, NJ HUD Metro FMR Area Ocean City, NJ MSA Philadelphia-Camden-Wilmington, PA-NJ-DE-MD MSA Trenton-Ewing, NJ MSA Vineland-Millville-Bridgeton, NJ MSA Warren County, NJ HUD Metro FMR Area
RESULTS FOR TRENTON, NJ
Trenton-Ewing, NJ MSA (NJ)
Two Parents, Two Children
|
Item |
Cost |
|
Monthly Housing |
$1206 |
|
Monthly Food |
$754 |
|
Monthly Child Care |
$1258 |
|
Monthly Transportation |
$607 |
|
Monthly Health Care |
$1519 |
|
Monthly Other Necessities |
$502 |
|
Monthly Taxes |
$447 |
|
Monthly Total |
$6292 |
|
Annual Total |
$75508 |
Family budgets are for 2013.
Learn more about EPI’s Family Budget Calculator
OVERVIEW: What Families Need to Get By: The 2013 Update of EPI’s Family Budget Calculator (EPI Issue Brief #368)
METHODOLOGY: Economic Policy Institute 2013 Family Budget Calculator: Technical Documentation (EPI Working Paper #297)
DATA: Download source data (Excel)
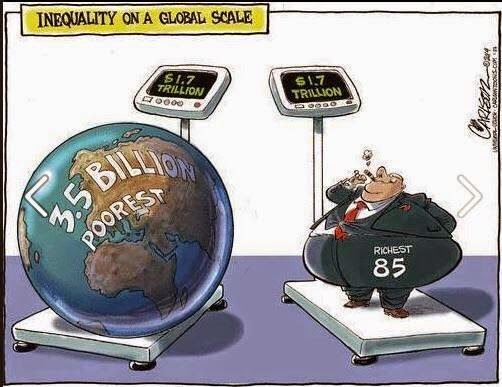
Visualizing Our Wealth Inequality
Wealth Inequality in America
Corporations Open New Push for Even More Favorable Tax Laws
Beware America! The push is on for yet another round of self-serving corporate tax reform. A press release from the Business Roundtable announced the release of a new report touting the economic benefits of “revenue neutral” corporate and individual tax reforms. Below is a summary of the findings from the press release and a link to the report. But before you read it, consider what the real trend is in corporate tax revenues compared with what individuals contribute.
HERE IS THE TRUTH! Corporate tax rates do not reflect what corporations actually pay in income taxes, and the effective corporate tax rates, as well as the percentage of tax revenues they contribute have been in decline for decades.
Decline in Corporate Tax Burden Over 40 Years

The shift in the percentage of total taxes paid by individuals has grown substantially over the years. Individual income taxes raised 41% of the total income tax revenue in 1943 compared to 79% of total revenues today. And the shift in tax receipts from corporations to individuals cannot be explained by a shift away from C corporations (who pay the corporate income tax) to S corporations (who don’t). An analysis of that shift in corporation type is an insignificant contributor to the overall shift in the tax burden. [http://rdwolff.com/content/massive-shift-tax-burden-corporations-individuals-statistical-mirage ]
Shifting the tax burden from corporations to individuals over the past 40 years is yet another factor contributing to the current decline in domestic consumer spending. Wage suppression, the shifting of the tax burden from the rich to the middle class, coupled with the decline in the tax burden on corporations are all that is needed to explain the decline of America’s middle class, the rise in poverty and the growth of government spending in social support programs. The people are going broke, the government is going broke trying to prop us up and the rich are becoming richer and more powerful each year.
PRESS RELEASE
BUSINESS ROUNDTABLE RELEASES ECONOMIC CASE FOR CORPORATE TAX REFORM
Comprehensive Data Analysis Shows Tax Reform Would Ensure U.S. Competitiveness and Lead to U.S. Economic Growth
Corporate Tax Reform – The Time Is Now
http://usahomecourt.org/resources/business-roundtable-releases-economic-case-corporate-tax-reform
Key components of the Roundtable’s analysis include: [also known as “talking points”]
- U.S. Companies’ Fiercest Competitors Enjoy Lower Home-Country Tax Rates: It is well known that the U.S. combined (federal and state) statutory tax rate is the highest of any developed nation, averaging 39.1 percent. As the analysis points out in detail, American companies now find that their closest foreign competitors are based in countries with lower corporate tax rates and international tax systems more favorable to their global operations than the U.S. rules. Since 2000, 30 of the 34 Organisation for Economic Co-operation and Development (OECD) countries have reduced their corporate tax rate.
- High Rates are a Drag on the U.S. Economy: Researchers at Cornell and the University of London report that a one-percentage-point decrease in the average corporate tax rate would result in an increase in real U.S. GDP of between 0.4 to 0.6 percent within one year of the tax cut.
- Double Tax on Foreign Earned Income Hurts American Companies and U.S. Competitiveness: Within the OECD, of companies headquartered outside the United States, 93 percent of the world’s top 500 companies (based on Fortune’s 2012 list) are headquartered in countries that use “territorial” tax systems, where income earned abroad is not taxed again when earnings are repatriated, unlike under the current U.S. system. This is up from only 27 percent of the same countries utilizing territorial systems in 1995 – signaling a significant trend towards the more competitive method of taxation.
- Under current law, foreign earnings are effectively “locked out” of the United States: An estimated $1.7 trillion in accumulated foreign earnings was held by the foreign subsidiaries of American companies in 2011. If only half of that amount came back to the United States in response to enactment of a market-based territorial tax system, the funds freed up for use at home would exceed the increased government spending and tax relief provided under the 2009 American Recovery and Reinvestment Act.
- Effective U.S. Corporate Tax Rate 12+ Percentage Points Higher than OECD Countries: Data in the new document disproves claims of low “effective” rates (amount of tax paid after deductions) paid by U.S. corporations, citing a new World Bank study of corporate income taxes in 185 countries for 2013 that finds that tax payments are higher for companies operating in the United States as a percentage of income than the average of other OECD and non-OECD countries. In fact, the U.S. effective tax rate (ETR) of 27.6 percent is more than 12 percentage points higher than the average of other OECD countries and 11 percentage points higher than the average of non-OECD countries. The analysis also explains why using the ratio of corporate income tax to GDP is an improper measure of effective rates.
- U.S. Workers Bear the Burden of the Outdated U.S. Corporate Tax System: Corporate Tax Reform – The Time Is Now also analyzes a number of recent studies that find that workers bear between half and three-quarters of the burden of the corporate income tax. These findings suggest reducing the corporate income tax rate would provide benefits to workers through higher wages.
CLASS WARFARE – OVERVIEW OF WAGES, TAXES and WEALTH IN AMERICA
Since Reagan in 1980’s Tax Rates for the wealth were cut in half and capital gains tax (where most make their money) was cut in half again. http://j.mp/ZFFQHB
Wages and GDP rose together until wages were suppressed in the 70’s, otherwise median income today would be greater than $100K instead of $51K http://j.mp/14MoT67
The combination of wage suppression and the collapse of the upper income tax brackets is the cause of our wealth and income inequality today. http://j.mp/102YbAk and http://j.mp/10DVrLn
A majority of American’s don’t make enough money to support a robust economy because a handful of us have more money than they can spend. http://j.mp/16E3zOT
Current US policy is creating permanent income inequality. Income mobility is shrinking as income caste system forms. http://t.co/nK5uFGyCaG
We know what victory looks like in Class Warfare. It’s the formation of an income caste system where birth determines your level of success. http://j.mp/Y1HwQP
Obama’s proposed raise in min. wage from $7.20 to $9/hr would mean a person working 40hr/week at min. wage would still be below poverty line. http://j.mp/10DwY7V
If the minimum wage was raised to $18/hour the Federal Government could eliminate almost all aid to the working poor, saving tons of money. http://j.mp/10DVrLn
Every tax dollar paid to assist the working poor is a tax subsidy providing their employer a federally funded labor discount. http://j.mp/16Bml7r
God! When are we going to wake up?
Living Wage Should Be Our Minimum Demand
Here are the facts: The federal minimum wage = $7.25 /hr. President Obama wants to raise it to $9.00 /hr. The current US Poverty wage = $10.60 /hr. The current living wage rate averages $16 to $23 /hr depending on where you live. The poverty wage rate and living wage rates are based on a 40 hour work week.
Profitable companies paying workers, or their out sourced or supply chain workers, less than a living wage are financially benefitting from government aid to the working poor. We need a stable work force to be competitive. We also can’t have people starving to death in the wealthiest nation on Earth. Companies take advantage of this and let state or federal governments step in to help care for their workers. This amounts to a labor discount. Cheap labor! Corporations are padding their profits at taxpayer expense.
At least 45% of working households require some form of government subsidy to maintain their financial stability. The cumulative effect of wage suppression over the past 40 years has become a huge taxpayer drain on households making more than the median income. While almost everyone’s wages are suppressed relative to GDP, the ranks of the working poor have grown to almost half of the work force. Business profits that have not been shared with workers over the years has gone instead to the wealtiest 1% of American’s creating the huge income inequality we have today.
In effect, profitable corporations and companies are making their higher paid employees subsidize part-time workers and full-time works who make less than a living wage.
So the next time you see that cleaning lady at work, remember your employer is expecting you to subsidize her family though income taxes rather than pay her the living wage she needs just to make ends meet. Every conservative argument against raising the minimum wage is just a smoke screen for the real culpret behind unemployment and our sluggesh economy, Wage Suppression!!!
Do Business Friendly Policies Reduce Poverty?
Do Business Friendly Policies Reduce Poverty?. A look at the numbers.
Half of All Full-time Employees Earn Less Than $19/hr.
Bureau of Labor Statistics
For release 10:00 a.m. (EDT) Thursday, October 18, 2012 USDL-12-2072
Technical information: (202) 691-6378 • cpsinfo@bls.gov • www.bls.gov/cps
Media contact: (202) 691-5902 • PressOffice@bls.gov
USUAL WEEKLY EARNINGS OF WAGE AND SALARY WORKERS THIRD QUARTER 2012
Median weekly earnings of the nation’s 103.6 million full-time wage and salary workers were $758 in the third quarter of 2012 (not seasonally adjusted), the U.S. Bureau of Labor Statistics reported today.
This was 0.7 percent higher than a year earlier, compared with a gain of 1.7 percent in the Consumer Price Index for All Urban Consumers (CPI-U) over the same period.
Data on usual weekly earnings are collected as part of the Current Population Survey, a nationwide sample survey of households in which respondents are asked, among other things, how much each wage and salary worker usually earns. (See the Technical Note.) Data shown in this release are not seasonally adjusted unless otherwise specified. Highlights from the third-quarter data are:
- Seasonally adjusted median weekly earnings were $765 in the third quarter of 2012, little changed from the previous quarter ($773). (See table 1.)
- On a not seasonally adjusted basis, median weekly earnings were $758 in the third quarter of 2012. Women who usually worked full time had median weekly earnings of $685, or 82.7 percent of the $828 median for men. (See table 2.)
- The female-to-male earnings ratio varied by race and ethnicity. White women earned 83.4 percent as much as their male counterparts, compared with black (93.2 percent), Hispanic (87.5 percent), and Asian women (73.1 percent). (See table 2.)
- Among the major race and ethnicity groups, median weekly earnings for black men working at full-time jobs were $633 per week, or 74.1 percent of the median for white men ($854). The difference was less among women, as black women’s median earnings ($590) were 82.9 percent of those for white women ($712). Overall, median earnings of Hispanics who worked full time ($556) were lower than those of blacks ($606), whites ($780), and Asians ($915). (See table 2.)
- Usual weekly earnings of full-time workers varied by age. Among men, those age 45 to 54 and 55 to 64 had the highest median weekly earnings, $976 and $980, respectively. Usual weekly earnings were highest for women age 35 to 64; weekly earnings were $740 for women age 35 to 44, $754 for women age 45 to 54, and $766 for women age 55 to 64. Workers age 16 to 24 had the lowest median weekly earnings, at $437. (See table 3.)
- Among the major occupational groups, persons employed full time in management, professional, and related occupations had the highest median weekly earnings—$1,300 for men and $948 for women. Men and women employed in service jobs earned the least, $530 and $440, respectively. (See table 4.)
- By educational attainment, full-time workers age 25 and over without a high school diploma had median weekly earnings of $464, compared with $648 for high school graduates (no college) and $1,170 for those holding at least a bachelor’s degree. Among college graduates with advanced degrees (professional or master’s degree and above), the highest earning 10 percent of male workers made $3,448 or more per week, compared with $2,311 or more for their female counterparts. (See table 5.)
Revision of Seasonally Adjusted Usual Weekly Earnings Data The Usual Weekly Earnings news release for the fourth quarter of 2012 will incorporate annual revisions to seasonally adjusted data for the number of full-time wage and salary workers and median weekly earnings in current dollars. (See table 1.) Estimates for constant (1982-84) dollar median weekly earnings also will be affected by revisions to the current dollar series. Seasonally adjusted estimates back to the first quarter of 2008 will be subject to revision.
Go to Tables: http://www.bls.gov/news.release/pdf/wkyeng.pdf
