Home » Posts tagged 'politics' (Page 2)
Tag Archives: politics
New Employment and Health Care Stats Refutes Obamacare Opponents
by Brian T. Lynch, MSW
The latest labor statistics and health care statistics refute the false claims being made against the Affordable Care Act (ACA) by Obamacare opponents. The claims and facts below are summarized from an excellent op/ed in Forbes magazine by Rick Ungar, which can be found here:
CLAIM: Obamacare will lead to a decline in full-time employment as employers reduce hours to below 30 per week to avoid providing health benefits.
FACT: Numbers just released by the Bureau of Labor Statistics (BLS), shows that part-time workers in the U.S. fell by 300,000 since the Affordable Care Act became law. This past year, the first full year of Obamacare health coverage, full-time employment grew by over 2 million. Part-time employment leaders who oppose Obamacare. Fewer cops, fewer teachers, fewer folks providing essential social services in the public sector all to make political point.
CLAIM: Millions of Americans are losing their individual health insurance policy due to Obamacare.
FACT: A new study by Lisa Clemans-Cope and Nathaniel Anderson of the Urban Institute found that prior to the Affordable Care Act the number of people kept their individual policy was very low with just 17 percent retaining coverage for more than two years.” The Urban Institute conducted a survey last December that asked 522 people between the ages of 18 and 64, “Did you receive a notice in the past few months from a health insurance company saying that your policy is cancelled or will no longer be offered at the end of 2013?” Only 18.6% said their plan was cancelled because it didn’t meet ACA coverage requirements, while the expected cancellation rate was 17% in the years prior to Obamacare. You can find the following bar graph and read more in Health Affairs.

The 18.6 percent who lost individual health insurance coverage due to the ACA requirements amounts to about 2.6 million people. According to the Urban Institute researchers over half of these folks will be eligible for coverage assistance. Still, roughly one million people will have to replace their cancelled policy with something that may cost them more. This isn’t good but it is less dramatic than what has been reported and most of these individuals would have been in the same boat prior to the ACA.
Facts matter – The Gallup-Healthways Well-Being Index was also just released. It reveals that 15.9 percent of American adults are now uninsured, down from 17.1 percent for the last three months of 2013. That translates roughly to 3 million to 4 million people getting coverage who did not have it before. The the number of Americans who still do not have health insurance coverage is on track to reach the lowest quarterly number since 2008.
There are currently 5 to 8 million people who can’t access Medicaid because their political leaders oppose Obamacare. That means the number of people being denied access to Medicaid expansion for political reasons is greater than the number who have signed up for Obamacare so far. The Rand Corporation recently analyzed 14 of the states with governors who oppose the Medicaid expansion and found their actions will deprive 3.6 million people of health coverage under Obamacare. These states will forgo $8.4 billion in federal funding. Moreover, their political opposition to Obamacare will cost these states $1 billion for programs that partially compensate medical providers who care for the indigent. (see Huffington Post: http://www.huffingtonpost.com/2013/06/03/medicaid-expansion_n_3367301.html).
Below is an excerpt and table of the uninsured by state that is taken from the Health Affairs Blog, which you can goto at: http://healthaffairs.org/blog/2014/01/30/opting-out-of-medicaid-expansion-the-health-and-financial-impacts/
Clearly, if the extreme efforts underway to by politicians to derail the Affordable Care Act was instead focused towards making it work, Obamacare would be wildly successful.
Examining the numbers. The number of uninsured people in states opting in and opting out of Medicaid expansion is displayed in Exhibit 1. Nationwide, 47,950,687 people were uninsured in 2012; the number of uninsured is expected to decrease by about 16 million after implementation of the ACA, leaving 32,202,633 uninsured. Nearly 8 million of these remaining uninsured would have gotten coverage had their state opted in. States opting in to Medicaid expansion will experience a decrease of 48.9 percent in their uninsured population versus an 18.1 percent decrease in opt-out states.
Exhibit 1: Uninsured Population by State, Pre- and Post-ACA

Here is a link to a website where you can check out state-by-state enrollments using an inter-active map: https://www.statereforum.org/tracking-health-coverage-enrollment-by-state?gclid=COCG7ffPob0CFYt9OgodPTQALQ
And this link is to an inter-active map showing the state-by-state status on Medicaid expansion: https://www.statereforum.org/Medicaid-Expansion-Decisions-Map?gclid=CJ_i4L3Rob0CFYuXOgod2RMA4g
Coal Ash Disaster Turns Capitalists into Socialists (Again)
by Brian T. Lynch, MSW
Commentary:
Coal ash is what’s left after coal is burned. It’s a toxic stew containing heavy metals including arsenic, lead and mercury. For many years Duke Energy has mixed coal ash with water and pumped this cocktail from coal fired power plants into huge open pits. In February, one of the sludge pits located in North Carolina began releasing millions of gallons of toxic coal ash into the Dan River, a source of public drinking water for thousands of people.

Photo and article: http://www.salon.com/2014/02/26/north_carolina_might_finally_crack_down_on_duke_energy_after_disastrous_coal_ash_spill/
Duke Energy spent millions over the years to keep government from properly regulating their waste products. For all those decades the stockholders and upper management of Duke energy have profited from this arrangement. Now that the inevitable has occurred, clean up effort will take years and cost a billion dollars. Millions more will have to be spent to correct the improper disposal problems that Duke Energy has practiced for decades.

Safely storing coal ash should have been a cost of doing business for Duke Energy all along, but they have deferred that cost to boost their profits. Now Duke Energy’s president and CEO, Lynn Good, thinks taxpayers should bear the cleanup costs. She said, “Ash pond closure has been a plan for very long time. And because that ash was created over decades for the generation of electricity, we do believe that ash pond disposal costs are ultimately a part of our cost structure.” She believes the burden of this clean up should be shared by everyone equally. (Corporate socialism? Again?)
Corporation are legally obligated to maximize profits for their shareholders. This would be fine if they were also legally obligated to paid the full cost of doing business without cutting corners. Cleaning up toxic spills is far more expensive than preventing themand regulations to enforce safe disposal are less expensive in the long run. But asking the victims of their environmental crimes to pay for cleaning up their mess and fixing their problem should not be an option.
(See also: http://www.politicususa.com/2014/03/14/republican-hypocrites-force-nc-taxpayers-pay-duke-energys-toxic-coal-ash-dumping.html )
Obama to Expand Executive Authority, Says Ezra Klein
by Brian T. Lynch – January 30, 2014
Yesterday evening Ezra Klein spoke at Drew University in Madison, New Jersey, as their guest lecturer. Ezra Klein is a journalist, blogger (Wonk Blog), political analyst and occasional guest star on MSNBC’s news opinion shows. At age 29 he is one of the most influential journalists in Washington, and he is currently creating his own internet news organization in collaboration with Vox Media.

Klein focused his remarks on the broad structures of modern American politics that explain the context for President Obama’s State of the Union address the night before. The President’s address, he started, was notable for what it didn’t contain. It didn’t contain any reference to getting any big new initiatives passed in Congress. President Obama has conceded that anything he proposes would be blocked from passage. Instead, Obama proposed plans to accomplish what he can through executive orders. He is using, and perhaps expanding his executive powers. The other remarkable feature of the President’s address was the specificity and scope of these executive plans. Klein spoke to both of these issues.
By objective measures, according to Klein, the U.S. Congress is the most polarized it has been in a long time. He pointed out that polarization is not synonymous with rancorous debates or disagreements. Polarization is a measure of the overlap between two political parties, the less overlap, the greater the polarization. He pointed out that in the 1950’s and early ’60’s the Democratic party was comprised of moderates, liberals from the North and conservatives from the South. The Republican party was also a blend of conservatives, liberals and moderates. Under these conditions there were pitched debates both between and within both parties. There were also ways to forge compromises between like minded representatives within each party.
The dynamic that blended the two parties this way was race, according to historians Klein cited. Once the civil rights act was passed and progress was made in racial integration, the Democrats lost the South and the two parties began reshuffling. Liberals moved into the Democratic Party and conservatives moved into the Republican Party. This resulted in less overlap and lead to the polarization we have today. In Klein’s view, the most conservative Democrat today has less in common with the most liberal Republican in that party, and vice versa. There is so little overlap that compromise is nearly impossible to achieve.
Party polarization and the inability to compromise leads directly to congressional stalemate (which Klein begrudging called “gridlock”). Under current conditions, when a minority party helps the majority pass legislation it makes the majority party look strong and effective, thereby improving their chances of being re-elected. Conversely, when the minority party obstructs the majority, it makes the majority party look ineffective and powerless causing voters to switch allegiances and elect the minority party. This, according to Klein, explains why the current congress is unable to act.
Without structural changes, such as the rise of a third party, Klein sees little hope for improvements in congress. The most powerful branch of government, the legislative branch, is at an impasse. According to Klein, that doesn’t mean nothing will be getting done. As he sees it, when congress can’t exercise its powers, the authority and power of the other two branches of government grows to fill the void. This isn’t necessarily a bad thing (but it does seem to require greater vigilance on our part). This brought Klein to his second observation about Obama’s State-of-the-Union address; the detailed account of where the Administration would be taking actions without the Congress.
The first two years of the Obama presidency saw the passage of more huge and important pieces of legislation than at any other time since the Lyndon Johnson administration. These are game changing initiatives with far reaching implications for American society. For example, the ACA has many little noticed, but broadly stated provision that will eventually re-invent (and improve) how treatment of common illnesses will be approached by doctors in the future.
Klein pointed out that most laws are written in general legalese that still requires Executive Branch interpretation and the creation of rules and policies to create an operating administrative framework. The 2,000 page Affordable Care Act, he said, has already generated tens of thousands of pages of rules, regulations and policies in a still unfolding process actuating the law. It is the creation of policy and administrative regulations that gives chief executives in state and federal government their most effective way to exercise power.
President Obama just announce that this is exactly what he intends to do. I will uses his executive powers to permanently shape the policies and interpretations of the legislation he got passed in his first term. He intends to accomplish the goals for which he was elected through the constitutional powers he has as the administrator-in-chief of the federal bureaucracy.
(Note: Once in place, the rules and administrative codes created to animate laws are, by intentional design, hard to alter. This is actually the role and purpose of a bureaucracy, to be a bulwark against the capricious dictates of power or transient swings of populist politics. Bureaucracies are often maligned for being cumbersome and slow to change, yet this is also their greatest contribution towards stable and coherent governance. This fact is little understood and seldom appreciated.)
Much of the beltway media has interpreted the President’s address as an admission that he is already a lame duck president, but nothing could be further from the truth. Klein believes that the rest of his term will produce enormous changes and benefits through executive actions. Because these changes will be happening in the nitty-gritty of agency bureaucracies it will be difficult for the beltway press to report on the changes.
The Washington media, according to Klein, has a structural bias towards the much easier reporting on Congress. The legislative branch is centralized, accessible and filled with characters and conflicts that sell the news. Administrative law is dry, decentralized and much less accessible. Still, this is where Klein sees the real action over the next few years. Perhaps this is where he intends to focus his attentions as he moves to create his new internet news venture with Vox Media. Time will tell.
Tyranny of the Minority – Part 2: Rise of the Neo-Confederate Secessionists
Graycoat Conservatives – The Neo-Confederate Secessionists
by Brian T. Lynch, MSW
They are still small in number, but spread widely across the county. They are articulate, highly motivated and influential members within the Tea Party, the Christian right movement, Libertarians groups and nationalist groups in every state. They are the philosophic rear guard of the conservative movement pulling conservatives ever further to the right. They may not have a central organization, but they do have a significant social media presence. They remain under the radar of the national press which fails to take them seriously. The best way to find them is to type “secessionist” into your internet search engine. They are the Neo-Confederates, a polarizing counter-force behind the growing rift in the Republican Party.
The secessionists anti-government interests overlap with the corporate conservative wing of the Republican Party, and both groups favor free market economics, but the graycoat conservatives envision a very different America. So while wealthy conservatives continue to fund the Tea Party, graycoat conservatives are busy winning over hearts and minds to their radical alternative.
The following graphic is taken from one of the many secessionist Websites. It maps the number of secessionist petitioners from around the country. In effect it shows where they are most active and how they are distributed across the country. It doesn’t represent how popular or unpopular the movement might be.
Plotting whitehouse.gov secession petitions

Signers to White House secession petitions by county. Color based on proportion of residents signing, with darker colors showing higher levels of secession support. Current as of 9am on Saturday, November 24th. Works best in Chrome or Safari.
Update: It looks like the secession petition movement has peaked.
Since Election Day, more than 60 petitions have been posted on the White House’s website requesting that states be allowed to withdraw from the United States and create their own government. As of November 13, 2012, the following states had active petitions: Alabama, Alaska, Arizona, Arkansas, California, Colorado, Delaware, Florida, Georgia, Idaho, Illinois, Indiana, Kansas, Kentucky, Louisiana, Michigan, Minnesota, Mississippi, Missouri, Montana, Nebraska, Nevada, New Hampshire, New Jersey, New Mexico, New York, North Carolina, North Dakota, Ohio, Oklahoma, Oregon, Pennsylvania, Rhode Island, South Carolina, South Dakota, Tennessee, Texas, Utah, Virginia, Virginias, West Virginia, Wisconsin, and Wyoming. [http://www.unc.edu/~ncaren/secessionists/]
A 2009 Zogby poll quoted on a number of secessionist Websites found that 20% of American’s believe states have a right to secede from the Union. Just today (12/18/13) Michael Hill, President of one of the Southern groups called League of the South, posted ten reasons for secession. They are:
- The U. S. government is an organized criminal enterprise, secession is the only way to return to legitimate government
- The U. S. economy is failing, secession makes economic sense
- The South’s unique history and culture is worth protecting
- The criminal nature of the bank bailouts and the Fed
- A dysfunctional national electoral system, secession may be the only way to restore integrity to elections
- Third World immigration into the South, secession removes the federal government’s interference and lack of performance
- Organic community vs. the globalism of the elites
- The implementation of an American police/surveillance state
- The Christian South v. secular America, secession provides the opportunity to return to Our Founding Principles
10. Because we think we can rule ourselves better than we are being ruled by DC, secession is a path to American Liberty http://dixienet.org/rights/2013/reasons_for_secession.php]
What these secessionist groups most have in common is a desire to facilitate the collapse of the Federal Government and the breakup of the Union of States. They see this as the natural and inevitable course of history. As they see it, every great empire has followed this path.

They oppose all forms of collectivism and eschew society as we know it. Among some groups there is a distinct “cultural” component. All groups seem to reject democratic majority rule. As one of them put it to me, ”
According to one person who wrote me, they are, “… committed to the cause of individual liberty and [individual] sovereignty. [They] would prefer secession, to revolution.” But revolution it will be if the majority opinion of the Americans go against them. They have a strong patriotic connection to our founding fathers even though their commitment to our Union is weak. Pin them down and they reluctantly choose the union of states over a return to a confederacy, but only if the Federal governments control over the states is weakened and individuals are free from all federal interference.
If you start to pin these folks down in a debate they squirm away. They are viscerally opposed to the our system of government, their anti-federal rage concealed only by their passion for an extreme interpretation of individual rights and freedoms. These passions are covered over by a thin veneer of selective scholarship. Scratch the scholarship and their passion flares. Challenge their constitutional interpretations and they circle the wagons.
They have no sense of responsibility towards society and nothing but contempt for majority rule. They believe the majority of American’s is just another special interest group, and one that is biased against minority rights. When majorities opinions prevail they force minorities to accede to their will which violates their rights. This is how they interpret the Constitution.
The only legitimate role they see for the federal government is the protection of the individual’s right to follow their conscience within Constitutionally defined boundaries. One major flashpoint seems to be taxes. They don’t want to pay any federal taxes, but when pressed say they agree to contribute only for spending within the limits of their narrow interpretation of the governments enumerated powers.
They resent being forced to pay taxes for national parks, education, environmental protection, food and drug administration, foreign diplomacy administration or anything else that isn’t specifically named in our Constitution. They claim a sovereign right not to pay for anything outside of the federal governments enumerated powers, as they define it. They reject all collectivism. For example they resent that the Federal government spends any money on highways and bridges, believing federal spending should be restricted to “postal roads.”
As one person wrote: ” For [the federal government] to “do” it must take. That violates rights. The only function of [government] is protect rights, not “do.”
Tenth Amendment: The powers not delegated to the United States by the Constitution, nor prohibited by it to the States, are reserved to the States respectively, or to the people.
The 10th Amendment is the source of their narrow interpretation of federal powers. Their interpretation provides all the justification they require. Below is a reprint from one of their Websites that lists the enumeration of federal powers which they feel the government has exceeded. These powers are listed on the Tenth Amendment Center Website where the members call themselves “Tenthers.: [http://tenthamendmentcenter.com/]
Disdain for the Federal Government or any large democracy is a central feature for these neo-confederate groups. They see majority as a special interest and would strip the government of its ability to show any favoritism to all special interests. This suggests that the only role of government must be the protection of the individuals rights yet they may concede collective rights to businesses. Perhaps this is why it is so important that corporations be viewed as people. It gives them individual status while denying other types of organization status as a collective entity.
MIDDLEBURY INSTITUTE PAPER V
http://middleburyinstitute.org/rightsandfreedoms.html
March 2007 – Introduction to “Minimal Rights and Freedoms of Individuals in a Sovereign State”
Because questions keep coming up as to the kinds of states that secessionist organizations are working toward, and because each organization in the movement has an interest in the objectives of any other organization, it seemed to us here that it might be appropriate to send out a suggested platform of the rights and freedoms that might be guaranteed to individuals in any future seceded state. [SNIP] There are important issues here and we hope you take them seriously.
MINIMAL RIGHTS AND FREEDOMS OF INDIVIDUALS IN A SOVEREIGN STATE
Rights to
Life, liberty, security
Equality before the law
Trial before competent tribunal, due process, counsel, appeal
Possess property and not be arbitrarily deprived thereof
Periodic elections with universal adult suffrage
Secession by any coherent unit
Freedoms of
Speech, opinion, expression in any media
Peaceable assembly, association
Belief, thought, religion, worship
Movement within any state, and to leave and return
Freedoms from
Slavery or servitude
Discrimination on the basis of race, color, sex, religion,
political belief, nationality, property, or birth
Torture or degrading treatment
Arbitrary arrest or detention
Invasion of privacy
Arbitrary deprivation of citizenship
Any action by the state to destroy or deny any of these rights and freedoms
Signators:
Middlebury Institute, February 2007
Second Vermont Republic, March 2007
Southern National Congress Committee, March 2007
The role of a state to infringe on individual rights is not well thought out among members of this group. Because states are smaller they believe them to be inherently less intrusive in the lives of individuals. They consider themselves to have an individual right to not be “interfered with” by any government, but apparently feel that smaller, state governments would be easier to control. In a large constitutional democracy, such as the United States, a majority opinion is viewed as a form of tyranny against individual dissenters, even if that majority opinion is deemed constitutional according the the Supreme Court. On the other hand, they don’t see anything wrong with a minority group preventing the majority from governing in opposition to them. They see this as their right and duty as “soverigien citizens.” It isn’t clear whether this is true only when the minority feels the government is legislating beyond its enumerated powers, or if they claim this right under all circumstances. As one person put it:
“But you don’t see that resisting (but not compelling) action from a majority isn’t a tyranny of the minority? The minority isn’t forcing the majority to do anything, only to refrain from forcing the minority to do something. The rights of any minority supersede the wants or needs of any majority.”
In the face debt ceiling financial cliffs, government shut downs, and the nearly total inability of Congress to pass legislation, it is time to recognize that there are forces on the far right, and in Congress, who see this as successful strategy. Their intentions are malevolent and quite contrary to the motivations most often attributed to them by political analysts in the main stream press. It is time to pay attention to these groups and their impact on American politics. A failure to open a public debate that directly confronts both the graycoat secessionists and the corporate elite now would be a huge mistake.
Austerity for Dummies, Like Us
Imagine owning a small manufacturing business with 25 happy employees. After paying overhead , suppliers, employees, benefits and your Potter’s Bank business loan you have just enough to get by.
One day your suppliers find they can’t get raw materials because of artifical shortages and price spikes caused by futures speculators that work at bank. The suppliers they need to borrow money to pay for higher priced raw materials, at least until they can adjust with worker layoff and cutbacks. Potter’s Bank charges them higher interest rates because now they’re “risky” borrowers.
Your suppliers must pass along their higher costs to you, so now its your turn to cut wages, benefits and hours. Your employees grumble and can’t keep up with the workload. Production stalls, but also sales start to drop because all the affected workers are also your customers.
One day you discover you can’t pay the bank loan, so you go to Potter’s Bank to renegotiate terms. Potter tells you what he has been telling everyone:
“You’re a credit risk! Your workers make too much and the cost of their benefits is rising. Cut benefits, cut wages, layoff some of those lazy workers and you will be more efficient. Only then will I loan you the money you need. Do as I ask or Ill raise your interest rates further or foreclose on your business.”
This is the austerity trap. Bankers use their leverage to play both ends against the middle forcing both businesses and governments to be more labor efficient. It squeezes more production out of fewer workers for lower wages and benefits. It also suppresses consumption because fewer consumers are employed and those who work have less income or job security. It doesn’t matter if austerity is imposed on businesses or the public sector, the effects are the same.
Imposing austerity is like digging a hole in the economy, the more you dig the deeper the hole. It is good for bankers but bad for workers. It increases corporate profits but reduces personal incomes (except for the very rich). It shrinks the size of government but reduces support to the poor and unemployed people it creates. What ever hurts workers hurts consumers which suppresses consumption and depresses the economy, which then hurts more workers in a literally vicious cycle.
Making debt reduction a priority during a recession, rather than creating jobs and putting money back into the hands of consumers, is austerity. As the article below points out with a graph, shutting down the government and causing the government sequester to lower government spending at this time has hurt recovery. It is the wrong prescription.
In a World Without Austerity…
By Adam Hersh | October 4, 2013
http://www.americanprogress.org/issues/economy/news/2013/10/04/76305/in-a-world-without-austerity/
Thanks to the federal government shutdown, there is an absence of new U.S. job market data for September 2013. Let’s take a moment to imagine the kind of economy we might see in the United States today had we not just lived through three years of fiercely divisive politicking for fiscal austerity—sharp cuts to public services and investments, as well as cuts to taxes on America’s wealthiest people.
If federal and state governments had not adopted policies of fiscal austerity, today’s jobs report from the Department of Labor would likely be telling us, as shown in Figure 1:
- U.S. employers added more than 260,000 jobs in September.
- The unemployment rate for September fell below 6 percent.
- Since December 2010, the U.S. economy has added more than 8.2 million new jobs—or 2.4 million more than have actually been added.

The Economy Didn’t Stall for Congress During Recession
by Brian T. Lynch, MSW
|
The Wealthiest US Legislators Estimated Net Worth
|
|
|
Issa, Darrell (R-Calf) House
|
$448,125,017
|
|
McCaul, Michael (R-Tex) House
|
$380,411,527
|
|
Harman, Jane (D-Calf) House
|
$326,844,751
|
|
Kerry, John (D-Mass) Senate
|
$231,722,794
|
|
Kohl, Herb (D-Wis) Senate
|
$173,538,010
|
|
Combined Wealth
|
$1,560,642,099
|


|
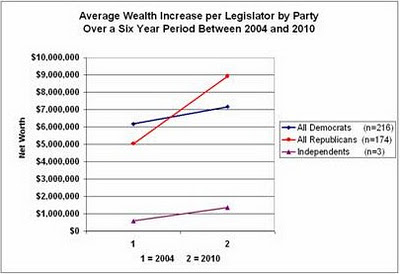
Average Wealth Increase per Legislator by Party and Chamber – 2004 and 2010
|
|||||
|
Wealth /Member in 2004
|
Wealth /Member in 2010
|
Six Year Dif /Member
|
Total % Change
|
Annual % Change
|
|
|
House Democrats (n=176)
|
$2,918,824
|
$4,408,237
|
$1,489,414
|
51.0%
|
8.50%
|
|
House Republicans (n=133)
|
$5,243,557
|
$10,111,971
|
$4,868,414
|
92.8%
|
15.47%
|
|
Senate Democrats (n=40)
|
$20,516,818
|
$19,323,256
|
-$1,193,561
|
-5.8%
|
-0.97%
|
|
Senate Republicans (n=41)
|
$4,394,130
|
$5,128,482
|
$734,352
|
16.7%
|
2.79%
|
|
Senate Independents (n=3)
|
$577,182
|
$1,359,855
|
$782,673
|
135.6%
|
22.6%
|


|
Total Wealth Increase of All US Legislators Between 2004 and 2010
|
|||||
|
Average Wealth in 2004
|
Average Wealth in 2010
|
Difference in Six Years
|
Total % Change
|
Annual % Change
|
|
|
All Members (n=393)
|
$2,213,699,631
|
$3,108,019,528
|
$894,319,897
|
40.4%
|
6.7%
|
|
All Democrats (n=216)
|
$1,334,385,659
|
$1,548,780,022
|
$214,394,363
|
16.1%
|
2.7%
|
|
All Republicans (n=174)
|
$877,552,427
|
$1,555,159,941
|
$677,607,514
|
77.2%
|
12.9%
|
|
Independents (n=3)
|
$1,731,545
|
$4,079,565
|
$2,348,020
|
135.6%
|
22.6%
|
|
Senators (n=84)
|
$1,002,563,604
|
$987,277,595
|
-$15,286,009
|
-1.5%
|
-0.3%
|
|
Congressmen (n=309)
|
$1,211,147,532
|
$2,120,971,945
|
$909,824,413
|
75.1%
|
12.5%
|
|
Average Wealth Increase Per US Legislator by Party and Chamber Between 2004 and 2010
|
|||||
|
Wealth /Member in 2004
|
Wealth /Member in 2010
|
Six Year Dif /Member
|
Total % Change
|
Annual % Change
|
|
|
All Members (n=393)
|
$5,632,823
|
$7,908,447
|
$2,275,623
|
40.4%
|
6.7%
|
|
All Democrats (n=216)
|
$6,177,711
|
$7,170,278
|
$992,566
|
16.1%
|
2.7%
|
|
All Republicans (n=174)
|
$5,043,405
|
$8,937,701
|
$3,894,296
|
77.2%
|
12.9%
|
|
Independents (n=3)
|
$577,182
|
$1,359,855
|
$782,673
|
135.6%
|
22.6%
|
|
Senators (n=84)
|
$11,935,281
|
$11,753,305
|
-$181,976
|
-1.5%
|
-0.3%
|
|
Congressmen (n-309)
|
$3,919,571
|
$6,863,987
|
$2,944,416
|
75.1%
|
12.5%
|
|
Average Wealth Increase of All US Legislators by Party Between 2004 and 2010
|
|||||
|
Average Wealth in 2004
|
Average Wealth in 2010
|
Difference in Six Years
|
Total % Change
|
Annual % Change
|
|
|
House Democrats (n=176)
|
$513,712,948
|
$775,849,769
|
$262,136,821
|
51.0%
|
8.50%
|
|
House Republicans (n=133)
|
$697,393,079
|
$1,344,892,164
|
$647,499,085
|
92.8%
|
15.47%
|
|
Senate Democrats (n=40)
|
$820,672,711
|
$772,930,253
|
-$47,742,458
|
-5.8%
|
-0.97%
|
|
Senate Republicans (n=41)
|
$180,159,348
|
$210,267,777
|
$30,108,429
|
16.7%
|
2.79%
|
|
Senate Independents (n=3)
|
$1,731,545
|
$4,079,565
|
$2,348,020
|
135.6%
|
22.6%
|
|
Average Wealth Increase per Legislator by Party and Chamber – 2004 and 2010
|
|||||
|
Wealth /Member in 2004
|
Wealth /Member in 2010
|
Six Year Dif /Member
|
Total % Change
|
Annual % Change
|
|
|
House Democrats (n=176)
|
$2,918,824
|
$4,408,237
|
$1,489,414
|
51.0%
|
8.50%
|
|
House Republicans (n=133)
|
$5,243,557
|
$10,111,971
|
$4,868,414
|
92.8%
|
15.47%
|
|
Senate Democrats (n=40)
|
$20,516,818
|
$19,323,256
|
-$1,193,561
|
-5.8%
|
-0.97%
|
|
Senate Republicans (n=41)
|
$4,394,130
|
$5,128,482
|
$734,352
|
16.7%
|
2.79%
|
|
Senate Independents (n=3)
|
$577,182
|
$1,359,855
|
$782,673
|
135.6%
|
22.6%
|
|
Top Ten Legislators /w Biggest Jump in Wealth ($ increase) by Party and Chamber – 2004 and 2010
|
|||||
|
Aggregated Totals
|
Average Wealth in 2004
|
Average Wealth in 2010
|
Difference in Six Years
|
Total % Change
|
Annual % Change
|
|
House Democrats (n=176)
|
$327,705,235
|
$568,142,204
|
$240,436,969
|
73.4%
|
12.2%
|
|
House Republicans (n=133)
|
$331,746,289
|
$1,005,864,579
|
$674,118,290
|
203.2%
|
33.9%
|
|
Senate Democrats (n=40)
|
$137,206,389
|
$216,341,049
|
$79,134,660
|
57.7%
|
9.6%
|
|
Senate Republicans (n=41)
|
$21,576,271
|
$81,888,741
|
$60,312,470
|
279.5%
|
46.6%
|
|
Top Ten Legislators /w Biggest Jump in Wealth ($ increase) by Party and Chamber – 2004 and 2010
|
|||||
|
Average per Legislator
|
Wealth /Member in 2004
|
Wealth /Member in 2010
|
Six Year Dif /Member
|
Total % Change
|
Annual % Change
|
|
House Democrats (n=176)
|
1,861,962
|
3,228,081
|
1,366,119
|
73.4%
|
12.2%
|
|
House Republicans (n=133)
|
2,494,333
|
7,562,892
|
5,068,559
|
203.2%
|
33.9%
|
|
Senate Democrats (n=40)
|
3,430,160
|
5,408,526
|
1,978,367
|
57.7%
|
9.6%
|
|
Senate Republicans (n=41)
|
526,251
|
1,997,286
|
1,471,036
|
279.5%
|
46.6%
|
|
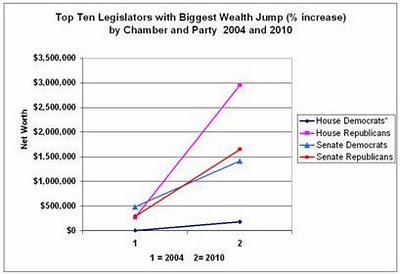
Top TenLegislators /w Biggest Jump in Wealth (% increase) by Chamber & Party – 2004 and 2010
|
|||||
|
Aggregated Totals
|
Average Wealth in 2004
|
Average Wealth in 2010
|
Difference in Six Years
|
Total % Change
|
Annual % Change
|
|
House Democrats*
|
$779,531
|
$31,996,557
|
$31,217,026
|
4004.6%
|
667.4%
|
|
House Republicans
|
$35,430,212
|
$392,877,862
|
$357,447,650
|
1008.9%
|
168.1%
|
|
Senate Democrats
|
$19,415,702
|
$56,516,827
|
$37,101,125
|
191.1%
|
31.8%
|
|
Senate Republicans
|
$11,871,405
|
$67,686,976
|
$55,815,571
|
470.2%
|
78.4%
|
|
Top TenLegislators /w Biggest Jump in Wealth (% increase) by Chamber & Party – 2004 and 2010
|
|||||
|
Average per Legislator
|
Wealth /Member in 2004
|
Wealth /Member in 2010
|
Six Year Dif /Member
|
Total % Change
|
Annual % Change
|
|
House Democrats*
|
$4,429
|
$181,799
|
$177,369
|
4004.6%
|
667.4%
|
|
House Republicans
|
$266,393
|
$2,953,969
|
$2,687,576
|
470.2%
|
78.4%
|
|
Senate Democrats
|
$485,393
|
$1,412,921
|
$927,528
|
191.1%
|
31.8%
|
|
Senate Republicans
|
$289,546
|
$1,650,902
|
$1,361,355
|
470.2%
|
78.4%
|
|
* One member, P. Kennedy, accounted for most of the increase. Excluding him for the in rank on the list yeilds an increase of 1,602.6% or 267.1% annual increase.
|
|||||
Carbon, Climate and a Mirror to Our Future
by Brian T. Lynch, MSW
If you asked most forward thinking Americans to name a disruptive challenge we face today, global warming would be high on the list. Climate changing levels of carbon dioxide have been released into the air and the impacts on weather, on raising ocean levels and melting glacier are underway. The most socially responsible among us are already reducing their carbon footprint by recycling, buying more efficient cars, better insulating their homes, buying Energy Star appliances, using florescent or LED lighting. More and more people are also taking advantage of incentive programs to install rooftop solar or wind power generation systems.
The impact from these early pioneers of change is still quite small relative to the problem, but it is significant. So significant, in fact, that the industries which release carbon dioxide to produce the energy we buy are feeling threatened. After all, every time you replace an incandescent light bulb with an LED bulb you reduce their revenue.
Our power generation and distribution companies can adapt by getting into the LED lighting business for example, or they can maladapt by killing government regulations and initiatives to reduce carbon emissions. It appears they have chosen to do both. Some energy companies are investing in wind, solar or other renewable energy technologies while others are busy hatching plans to manipulate the democratic process in order to scuttle government incentives and regulations that threaten their bottom line.
When the power generation utilities think about the disruptive challenges we face as a nation they quite literally see a mirror image of what the rest of us see. The threats they see include “demand side management” (DSM) which refers to consumer energy conservation measures, and “distributed energy resources” (DER) meaning residential power generation such as rooftop solar systems. This is explained in an national industry report released this past January by the Edison Electric Institute. Entitled, “Disruptive Challenges, Financial Implications and Strategic Responses to a Changing Retail Electric Business,” the report describes how disruptive consumer conservation and residential energy generation can be to their business. To help electric utility executives better understand the disruptive forces of socially responsible citizens it offers this useful flow chart: [http://tinyurl.com/m5py4rg]
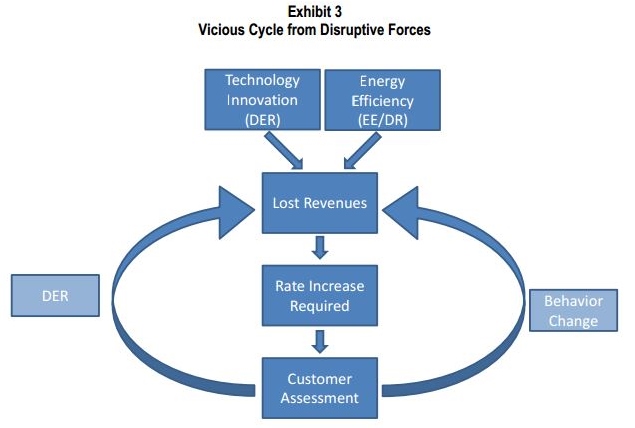
Edison Electric Institute, Washington, D.C. – www.eei.org
Another study conducted for PacifCorp was released in March of 2013 by The Cadmus Group, Inc., another D.C. based firm. This industry study looks at the potential impact of consumer conservation on corporate energy sales over the next 20 years in states served by the Pacific Power and Rocky Mountain Power Companies. The Cadmus Group defined DSM this way:
Demand-side management involves reducing electricity use through activities or programs that promote electric energy efficiency or conservation, or more efficient management of electric energy loads. These efforts may:
- Promote high efficiency building practices
- Promote the purchase of energy-efficient ENERGY STAR® products
- Encourage the transition from incandescent lighting to more efficient compact fluorescent lighting
- Encourage customers to shift non-critical usage of electricity from high-use periods to after 7 p.m. or before 11 a.m.
- Consist of programs providing limited utility control of customer equipment such as air conditioners
- Promote energy awareness and education
This report suggests that energy conservation efforts and residential power generation over the next twenty years will reduce these energy company sales by up to 15%. About 76% of this reduction will come from residential customers, mostly from conservation measures. Numbers like these are causing energy companies everywhere to start defending their business model. The Arizona Public Service Company, for example, recently funded non-profit agencies to start what looks like a grass roots attempt to turn public opinion against both rooftop solar and the states’ publically elected Arizona Corporation Commission, which has final authority over utility rates. Rooftop solar initiatives are a prime target for utility companies both because of its rapid growth and the direct way these installations impact utility company profits. The reason why conservation efforts and residential power generation may be scary to utility companies from a business perspective becomes clear when you look at the bigger picture.
The history of U.S. energy use is one of annually increasing demand. Population growth and consumer purchases of more energy reliant products guarantee increased electric demand well into the future. It remains a growing market, but the rate of growth is slowing. This has been true since the 1950’s. According to the U.S. Energy Information Administration, “The growth of electricity demand (including retail sales and direct use) has slowed in each decade since the 1950s, from a 9.8-percent annual rate of growth from 1949 to 1959 to only 0.7 percent per year in the first decade of the 21st century.” The following chart shows how the increase in electric demand is declining in this country.

US. Energy Information Agency http://tinyurl.com/nnz9rgg
Meanwhile coal continues to be the biggest fuel source for power plants. The use of coal accounts for about 42% of the electricity we generate. Coal is expected to remain predominate though 2040, although its share of the energy generation mix will fall to around 35% of the total as natural gas and renewable energy soruces grow. This means that for the foreseeable future carbon emissions and growing electricity demand will still be with us if nothing changes. Of course nothing ever stays the same. The real question is whether the energy utilities, reacting to market forces, will dominate the direction we take in producing carbon based energy or whether pressure to save the planet will rise to a point where we can achieve meaningful reductions in green house gas emissions.
Bogus Claim: Obama Uses IRS to Buy Votes
There appears that a phony new scandal is taking shape on some conservative corners of the internet. It may or may not gain traction, but it is worth a peek. David DeVine, on the Website entitled TheWestern Free Press, and others, are accusing President Obama of using the IRS to create “de facto amnesty” for illegal aliens. It has to do with an aspect of federal tax law that has been ignored for years.
Here is the actual claim:
ITIN amnesty scam empowers Obama IRS to buy votes
“Outraged that illegal aliens claimed child-tax-credits, but no outrage that current tax law allows them to report income and pay taxes without threat of deportation?”
Apparently some on the right have finally discovered that many resident aliens actually do have IRS identification numbers that allow them to file and pay their federal income taxes and receive some tax benefits.
For years now rightwing conservatives have complained that undocumented aliens (by which they usually mean all non-citizens of color) don’t pay taxes and are a burden to taxpayers. This has never been entirely true, of course. Even setting income taxes and payroll deductions aside, all resident aliens pay sales taxes, property taxes (sometime indirectly by paying rent), gas taxes, cigarette taxes, tolls, fees , etc. But the biggest misconception has been that most resident aliens don’t pay income taxes. Many, perhaps most resident aliens do pay income taxes. Even my liberal friends have had a hard time believing this.
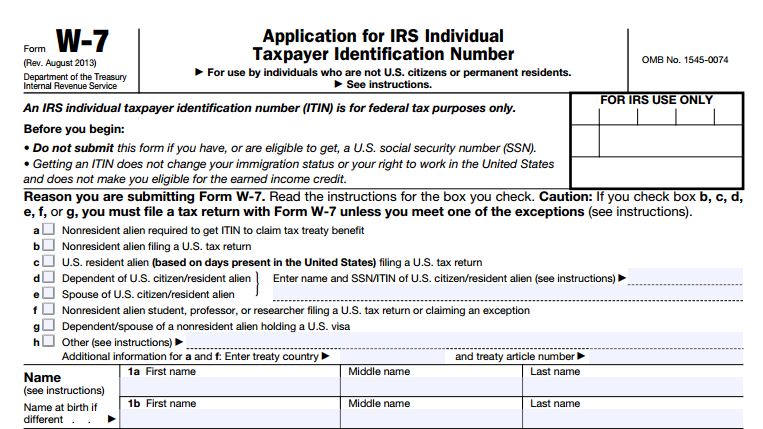
For more than forty-years the IRS has issued a nine-digit Individual Taxpayer Identification Number ( IRS application form W-7) to resident aliens who are not eligible to apply for Social Security. These identification numbers may be issued to resident aliens who earn income in the U.S. and either have a “Green Card” eligibility or meet the “Substantial Presentence” eligibility test. In fact, the instructions on the W-7 states, “A foreign individual living in the United States who does not have permission to work from the USCIS, and is thus ineligible for a SSN, may still be required to file a U.S. tax return”, and therefore obtain an Individual Taxpayer Identification Number (ITIN). So regardless of how a foreign citizen came to be here, if they earn money while here they are required to file income taxes. For example, a foreign citizen who came here in January and earned money and is still here in December must file income taxes and apply for the ITIN by attaching the application to their return.
Depending on their status and circumstance they may also be eligible to receive federal tax rebates and some other benefits under the tax law for themselves or their dependents. This includes the Child Tax Credit when a dependent child is a citizen or meets criteria in the IRS code. What resident aliens cannot collect is the Earned Income Tax Credit. It says so right on the ITIM application.
These IRS issued ITIN’s have be around at least since the 1960’s but some on the right what to use this rediscovered revelation to accuse President Obama of buying votes by making the IRS issues Child Tax Credits to “illegals.” This claim ignores the fact that all resident aliens are ineligible to vote. Some conservatives also want to pin on Obama their outrage that undocumented aliens are even allowed to report income without the threat of deportation. They would prefer, I suppose, that undocumented aliens be exempt from paying income tax, or else forced to hide their income out of fear of instant deportation.
Immigration enforcement is not the job of the IRS. It is their job to collect taxes on all residents who earn income regardless of whether they are citizens. It will be interesting to see if this issue gains traction or finds its way into round 2 of the immigration reform debate on the horizion.
A Passionate Call for an Alternative to Poliltics
What follows is the very essence of passion and disphoric expression by the next generation towards today’s intractable political systems that serve the interests of the rich and powerful. Russel Brand’s passion and rejection of establishment processes to bring about change mirror the essence of the Occupy movement. The outragiously disparate distribution of wealth and power has so distorted and hoplessly incumbered politics and democracy that he and many young people today are repulsed by it all. They struggle for an alternative that doesn’t yet exist and may never exist. The rant is perhaps a glimps into the hearts and minds of the coming generation. Through the social media an emotional consensus is building which has no clear expression or pathway to change.
Actor Russell Brand reduces BBC newsman to stunned silence with diatribe against corporate oligarchy
By Travis Gettys
Thursday, October 24, 2013
Actor and comedian Russell Brand is calling for a political and philosophical revolution in his guest editorship of the New Statesman magazine, and he explained what he wants to see in a passionately argued interview on BBC’s “Newsnight.”
Combative host Jeremy Paxson asked the British actor, who’s known for his past drug use and his brief marriage to pop singer Katy Perry, what gave him the right to promote his political beliefs, particularly since he’s never voted.
“I don’t get my authority from this preexisting paradigm, which is quite narrow and only serves a few people,” Brand said. “I look elsewhere for alternatives that might be of service to humanity.”
Ted Cruz, Money and the Power to Turn Out The Lights
Most people agree that Senator Ted Cruz, a freshman Senator from Texas, is the quartback of the federal government shutdown. He has his ideological reasons for pulling the plug, for sure, but instead of following the confusing politics behind his crazy Jihad against Obamacare, I decided to follow the money trail that backs him. Ultimate it is money, not ideology, that translates into the power to shutdown the federal government.
In the 2012 election Club for Growth and the Senate Conservative Fund were Sen. Cruz’ top two donors. These conservative fund raising groups contributed over a million dollars to his campaign.
The Senate Conservative Fund (SCF) was Cruz’ second biggest donor, contributing $385,103 to his campaign, according to OpenSecrets.org. The SCF is a leadership PAC, which means it is money raised by other politicians to support certain candidates running for office within their own party. The SCF is associated with James W. DeMint, a former South Carolina Senator and the current president of the conservative Heritage Foundation. SCF gave about $2.1 million to Republican candidates in the 2012 election cycle, which means Ted Cruz received 18% of their direct candidate support. This is significant since James DeMint has been characterized as the hidden hand behind the move to defund the Affordable Care Act (aka: Obamacare).
Club for Growth (CFG) contributed $705,657 to Ted Cruz, making them his biggest donor. That donation amounted to almost 17% of all the money CFG spent in contributions to support Republicans in the 2012 election. Only Senator Jeff Flake of Arizona received more money from CFG (one-million dollars).
But the most revealing fact about CFG’s support for Cruz is that the organization spent $4.27 million supporting a few Republican candidates while also spending a whopping $10 million (in outside spending) to oppose other Republican candidates. In other words CFG is like a wrecking ball destroying fellow Republican candidates who don’t meet their conservative standards.
I tried to learn where CFG gets its money, but this is difficult because it is a “527” organization, a 501(c)4 not for profit, that is allowed to collect unlimited contributions. CFG doesn’t have to disclose its donors or reveal its activity. According to a February, 2011 article by John Nichols of The Nation, The Club for Growth is “an organization funded by extremely wealthy conservatives to carry out their budget-stripping goals.”
What seems to emerge from this view of the government shutdown is a tectonic rift in the financial power base underneath the Republican party. Well organized and well funded sources of money are narrowly targeting resources to heavily fund a select few candidates while, in the case of Club for Growth, using resources to undermine Republican candidates who are less ideologically pure. Indeed, Club for Growth uses its club to cull the herd, a development that has no equal in Democratic politics.
Up until now the Senate and House Majority Leaders held all the purse strings of power to punish or reward members of their party. Not so any more. Ted Cruz does not stand alone when he defies his Republican colleagues in the Senate, as pundits have suggested. Rather, he is the tip of an iceberg around which his caucus has to navigate. He is able to side steps House Speaker John Beohner and whips support for defunding Obamacare in the House because he carries with him both a carrot and a club.
It is difficult to work out all the implications that may result from this rift in the fabric of Republican politics, but over the short term it can’t be very good. The rift is just the public view of a subsurface divide between the wealthy elite who are the titians of power in America. It isn’t clear, to me, exactly what is at play. What are the control points that one group seeks over the other and what would be the gain? Intrigue at that level of play is heavily cloaked in secrecy. For now, all we can do is to try and read the tea leaves.
