Four Graphs on What Hurts the Working Class
We never hear any reference to the working class these days. The media and our politicians only speak of the “middle class” as if that covers everyone who isn’t either poor or wealth. Even references to the poor are scarce. The working class exists. They are sandwiched between the poor and the middle class and they are being squeezed into poverty. It is cruel to ignore them and the terrible pain they are suffering. What has happened to them, aside from being ignored can only be touched on by the four graphs that follow. These were presented in a conversation I had with conservative friend of mine who has forgotten the working class exists. There are many factors hurting the working class. This conversation was only about four factors, wage suppression, the upward redistribution of wealth, working class decent into poverty and declining upward mobility. Post this is my way of addressing what I believe is the most hurtful factor of them all… public silence.
Q: I always thought of the owners as the producers of the jobs that the workers have. You say that it is the workers who are the producers. Have you ever been employed by someone on welfare?
A: Owners coordinate the workforce, but it the employees who do the work that makes the products or services. So in a real sense, the workers ARE the producers. And this has nothing to do with welfare at all. Jobs are not a product. Stuff is a product. Things to sell or trade is a product. Workers are key to making stuff or offering stuff yet when they want a fair share of the value they create they are treated like thieves. Read this and you will know what I am talking about even if you don’t agree:
http://aseyeseesit.blogspot.com/…/fair-wage-for-days…

I also just ran across this table (below) that shows were all the Hourly GDP wealth has gone since the mid-’70’s.
Source: https://scontent-a-lga.xx.fbcdn.net/hphotos-prn2/1480602_10200873563747333_1576469932_n.jpg
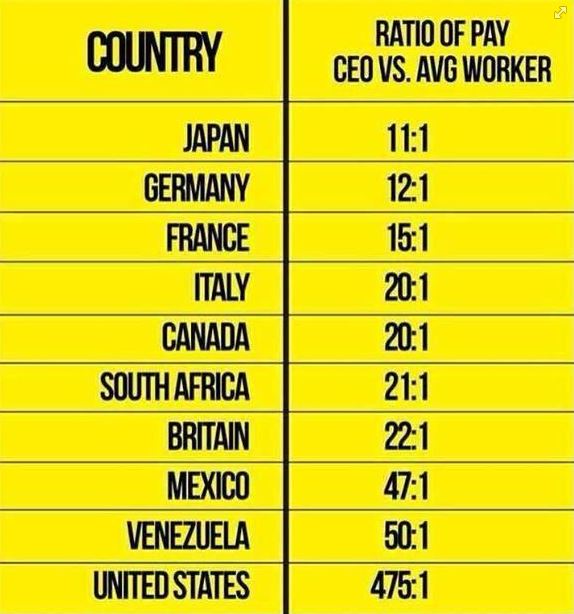
Q: Why should it matter how much a C.E.O. makes if their workers remain on the job? It’s one of the great things about this country. You can work where ever and for whom ever you want. Someone please explain to me why it is greed for C.E.O.’s to make deals to be paid as much as the market will bear but it is ok for workers to make deals to make as much as the market will bear.
A: It may not matter to you at all, but anyone who wonder why they can’t have collective barganing while the CEO is making 400 times their salary might have questions, especially since this is strictly a feature of the US economy and others around the world are paid better than we are relative to their economies.
Don’t forget, almost 40% of people who work full time are poor. I’m not sure what percentage of the poor they account for, but it is clear when we speak of the poor we are not speaking only of people who are disabled, elderly, retired or unemployed.

http://upload.wikimedia.org/wi…/en/7/74/Pov_crossnatl.jpeg
Note here that in the US, the number of working poor (blue bar in right hand column) is twice the number of non-working poor. So when you and I talk about the poor, you are defining it as welfare recipients while I broadly define it as everyone living below the poverty line, the majority of whom work full time. That’s partly why we have a disconnect on this topic. In my understanding, most poor people work.
Q: I wonder how many of the poor who are now C.E.O.’s would agree with you? Or would they say : “Work hard towards your goal, as I did, and you can achieve anything.”. Isn’t this what made our economy great? Not people who wanted a wage so they could be comfortable in the position they have today? Flipping burgers at McDonalds is not supposed to be a permanent career goal. Even the management at McDonalds wants people to move up. Or am I wrong about incentive and ambition?
A: There are 17,000 companies with 500 employees or more. There are 43 million poor. If 20% of CEO’s started out as poor children that would mean there are only about 4,200 CEO openings for 43 million potential applicants. It’s a safe bet that far fewer than 20% of CEO’s come from poverty. In fact, less than 20% of children born to poorest families will make it into the middle class in their lifetime. Less than 8% will make over $140k/year, which is approximately the income line where the richest fifth starts. Of those at the top, only the smallest fraction will become a CEO. I believe that if you really understood the economic situation in America you, of all the folks I know, would be a big supporter of the working class.

source: http://www.pewtrusts.org/…/Eco…/PEW_Upward%20EM%2014.pdf
As for incentive and ambition, a good paying job that makes one economically self-sufficient is the highest motivator. But a self-sufficient wage for a single earners is over $30,000/year whereas the median wage for a single earners is less than $26,000/year. In other words, the incentives are less than optimal in today’s economy, and no amount of hard work or individual effort will make a difference for most people until even low wage workers receive a fair wage for a days work.
Are Banks Banking On Student Debt?
by Brian T. Lynch, MSW
College graduates have always earned more in their lifetime than non-college graduates, but higher tuition costs is increasing borrowing and the higher interest rates on these loans is taking a bit out of their future. In addition, there continues to exist a higher unemployment rate for college graduates.
The Federal Reserve Bank of New York just released its quarterly Household Debt report. It reveals that non-housing debt is rising and student loans are a big contributor. Non-housing debt increased 2.8% since last quarter and 4.9% from a year ago. Housing debt decreased 1.9% from a year ago.
Looking at just the non-housing debt, student loans account for 36% of the total, up a percent from a year ago. Auto loan debt is increasing faster over the last year and now accounts for 30% of all non-housing debt. Student loan debt rose 4% from the last quarter and 7.29% from a year ago. Meanwhile credit card debt is unchanged over the past 12 months while other forms of non-housing debt declined by over 3%.
The Federal Reserve also reported good news that 90-day delinquency rates on household debt has declined. For the banking industry it is a twin blessing when borrowing rises and delinquency falls. For consumers it is a mixed blessing, at best. But, when you look at the particular, it is immediately clear that college educated adults are in serious trouble. They are defaulting as never before. Look at the line graph below and you will see what I mean. The student loan default is the red line that starts as the third highest default rate in 2004 to exceed credit card and auto loan defaults as of last year.

Source: Fed Report http://www.newyorkfed.org/regional/householdcredit.html
According to the Fed report, outstanding student loan balances increased to $1.027 trillion as of September 30, 2013, a $33 billion increase from the second quarter. The 90+ day delinquency rate increased, and is now at 11.8%.
Full Report: http://www.newyorkfed.org/research/national_economy/householdcredit/DistrictReport_Q32013.pdf
Higher tuition costs means greater borrowing which results in higher monthly payments on the debt. The high rate of unemployed, or underemployed college graduates is part of the reason for the higher default rates. What follows is a snippet from an excellent article in the Atlantic Monthly. (Go there to read it in full)
How Bad Is the Job Market For College Grads? Your Definitive Guide
JORDAN WEISSMANN APR 4 2013
They’re Better Off Than High School Grads … Bachelor’s holders (in blue below) have about half the unemployment rate of high school graduates (in red below). BA’s are still suffering from double the low rate of joblessness they enjoyed pre-recession. And yes, they’re even worse off than they were during the tepid economies of the early nineties or pre-housing bubble oughts. But on the whole, you’d much rather have a degree in this job market than not.

But They’re Still Hurting… That’s all bachelor’s holders, though (or at least the ones over 25, who the Bureau of Labor Statistics routinely tracks). So what about young adults just off campus? The numbers aren’t a nightmare, but they aren’t especially pleasant either. Last month, the Bureau released a special report looking at Americans under 30 who’d earned a bachelor’s in the past year, as of October of 2011. About 73 percent were employed (the paper didn’t specify between full time and part-time). More than 11 percent were still looking for work.

In addition to the higher rate of unemployment, rising tuition costs over the past decade has meant larger monthly payments. College tuition costs have even risen faster than medical costs, and much faster than the consumer price index. Below is a very clear graphic depiction of this from Professor Mark J. Perry out of the University of Michigan.
Professor Mark J. Perry’s Blog for Economics and Finance
The chart above illustrates graphically the “higher education bubble” by comparing the annual increases in the CPI for “College tuition and fees” (7.45% per year since 1978) to annual increases in the CPI for “medical care” (5.8% per year since 1978) to annual increases in the median price for new homes (4.3% per year) to the annual increases in the “CPI for all items” (3.8% per year) 
[See more at: http://mjperry.blogspot.com/2011/07/higher-education-bubble-college-tuition.html#sthash.HF1DSyOu.dpuf ]
The good news, according to the Trends in Education Website, is that the rate of tuition increases is declining. Here below is a snippet from their Website.
Average Rates of Growth of Published Charges by Decade
The 2.9% one-year increase in average published tuition and fees for in-state students at public four-year institutions in 2013-14 was 0.9% after adjusting for inflation. This relatively small increase in prices means that despite very large annual increases earlier in the decade, tuition inflation between 2003-04 and 2013-14 was similar to that between 1983-84 and 1993-94.
Figure 4: Average Annual Percentage Increases in Inflation-Adjusted Published Prices by Decade, 1983-84 to 2013-14
See Key Points|See Also Important
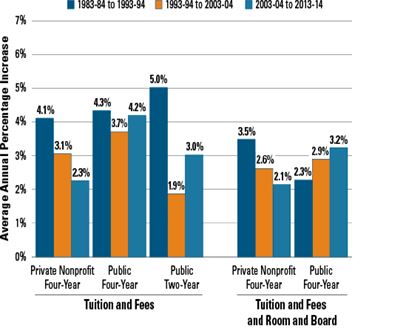
Each bar in Figure 4 shows the average annual rate of growth of published prices in inflation-adjusted dollars over a 10-year period. For example, from 2003-04 to 2013-14, average published tuition and fees at private nonprofit four-year colleges rose by an average of 2.3% per year beyond increases in the Consumer Price Index.
A third reason why so many college students are unable to pay their loans is the rising cost of financing those loans. Karen Weise recently wrote a an article in Business Week that laid out the problem of higher student loan rates. A snippet appears below.
Why Your Student Loan Interest Rate Is So High
By Karen Weise April 04, 2013
Business Week
Joe Szczepaniak pays a 3.5 percent interest rate on the mortgage for his house in a Chicago suburb. His car loan is 1.79 percent. The federal education loans he took out to send his four sons to college? They’re all above 7 percent. “Student loans have been the big black holes of my budget,” he says. Szczepaniak, who calls himself “Mr. Quicken” because he carefully tracks his finances, questions why the $200,000-plus he owes on the student loans doesn’t “reflect reality” and today’s low rates.
The answer is that Congress, not the market, sets rates for federal loans—which account for 85 percent of the roughly $1 trillion in outstanding education debt—and refinancing to a lower rate is rarely an option. Now some lawmakers and private lenders are looking for ways to give education borrowers more repayment and refinancing options.
[Read more at http://www.businessweek.com/articles/2013-04-04/why-your-student-loan-interest-rate-is-so-high ]
Student loan rate had been set to double, so congress acted to mitigate the sudden increase that was to occur. There is good information on the Consumer Financial Protection Bureau Website detailing the recent changes. An update on government student loan interest rates was recently published (see below). At a time when I can get a car loan from my credit union with an interest rate below 3%, our college students can’t get a federally subsidized student loan for under 3.86%, and private bank loans for students is even higher.
Consumer Financial Protection Bureau
Updated on August 13, 2013:
Last week, the president signed legislation passed by Congress to adjust federal student loan interest rates for this academic year. Here’s what the new rates look like:

http://www.consumerfinance.gov/blog/changes-to-federal-student-loan-interest-rates/
We have to stop and ask ourselves what the long term impact will be on our children and our economy if we don’t do more to make college affordable.
Austerity for Dummies, Like Us
Imagine owning a small manufacturing business with 25 happy employees. After paying overhead , suppliers, employees, benefits and your Potter’s Bank business loan you have just enough to get by.
One day your suppliers find they can’t get raw materials because of artifical shortages and price spikes caused by futures speculators that work at bank. The suppliers they need to borrow money to pay for higher priced raw materials, at least until they can adjust with worker layoff and cutbacks. Potter’s Bank charges them higher interest rates because now they’re “risky” borrowers.
Your suppliers must pass along their higher costs to you, so now its your turn to cut wages, benefits and hours. Your employees grumble and can’t keep up with the workload. Production stalls, but also sales start to drop because all the affected workers are also your customers.
One day you discover you can’t pay the bank loan, so you go to Potter’s Bank to renegotiate terms. Potter tells you what he has been telling everyone:
“You’re a credit risk! Your workers make too much and the cost of their benefits is rising. Cut benefits, cut wages, layoff some of those lazy workers and you will be more efficient. Only then will I loan you the money you need. Do as I ask or Ill raise your interest rates further or foreclose on your business.”
This is the austerity trap. Bankers use their leverage to play both ends against the middle forcing both businesses and governments to be more labor efficient. It squeezes more production out of fewer workers for lower wages and benefits. It also suppresses consumption because fewer consumers are employed and those who work have less income or job security. It doesn’t matter if austerity is imposed on businesses or the public sector, the effects are the same.
Imposing austerity is like digging a hole in the economy, the more you dig the deeper the hole. It is good for bankers but bad for workers. It increases corporate profits but reduces personal incomes (except for the very rich). It shrinks the size of government but reduces support to the poor and unemployed people it creates. What ever hurts workers hurts consumers which suppresses consumption and depresses the economy, which then hurts more workers in a literally vicious cycle.
Making debt reduction a priority during a recession, rather than creating jobs and putting money back into the hands of consumers, is austerity. As the article below points out with a graph, shutting down the government and causing the government sequester to lower government spending at this time has hurt recovery. It is the wrong prescription.
In a World Without Austerity…
By Adam Hersh | October 4, 2013
http://www.americanprogress.org/issues/economy/news/2013/10/04/76305/in-a-world-without-austerity/
Thanks to the federal government shutdown, there is an absence of new U.S. job market data for September 2013. Let’s take a moment to imagine the kind of economy we might see in the United States today had we not just lived through three years of fiercely divisive politicking for fiscal austerity—sharp cuts to public services and investments, as well as cuts to taxes on America’s wealthiest people.
If federal and state governments had not adopted policies of fiscal austerity, today’s jobs report from the Department of Labor would likely be telling us, as shown in Figure 1:
- U.S. employers added more than 260,000 jobs in September.
- The unemployment rate for September fell below 6 percent.
- Since December 2010, the U.S. economy has added more than 8.2 million new jobs—or 2.4 million more than have actually been added.

Obamacare – Is It For Good or Evil?
Like anything else, you can use a thing or abuse it. The Affordable Care Act is being shredded for political reasons in many states to create proof that it doesn’t work. It’s a shambles in the hands of those who want to use it as a cudgel with which to beat up Obama. More enlightened states are taking every advantage of the ACA and in doing so they are better serving their citizens and improving their state budgets. Here below is a snippet from an article in the Washington Post:
How we got Obamacare to work
By Jay Inslee, Steve Beshear and Dannel P. Malloy, Published: Washington Post, November 17, 2012
[snip] In our states — Washington, Kentucky and Connecticut — the Affordable Care Act, or “Obamacare,” is working. Tens of thousands of our residents have enrolled in affordable health-care coverage. Many of them could not get insurance before the law was enacted.
People keep asking us why our states have been successful. Here’s a hint: It’s not about our Web sites.
Sure, having functioning Web sites for our health-care exchanges makes the job of meeting the enormous demand for affordable coverage much easier, but each of our state Web sites has had its share of technical glitches. As we have demonstrated on a near-daily basis, Web sites can continually be improved to meet consumers’ needs.
The Affordable Care Act has been successful in our states because our political and community leaders grasped the importance of expanding health-care coverage and have avoided the temptation to use health-care reform as a political football.
In Washington, the legislature authorized Medicaid expansion with overwhelmingly bipartisan votes in the House and Senate this summer because legislators understood that it could help create more than 10,000 jobs, save more than $300 million for the state in the first 18 months, and, most important, provide several hundred thousand uninsured Washingtonians with health coverage.
In Kentucky, two independent studies showed that the Bluegrass State couldn’t afford not to expand Medicaid. Expansion offered huge savings in the state budget and is expected to create 17,000 jobs.
In Connecticut, more than 50 percent of enrollment in the state exchange, Access Health CT, is for private health insurance. The Connecticut exchange has a customer satisfaction level of 96.5 percent, according to a survey of users in October, with more than 82 percent of enrollees either “extremely likely” or “very likely” to recommend the exchange to a colleague or friend.
In our states, elected leaders have decided to put people, not politics, first.
[Read more here: http://www.washingtonpost.com/opinions/how-we-got-obamacare-to-work/2013/11/17/3f2532bc-4e42-11e3-be6b-d3d28122e6d4_story.html ]
_______________ … _______________
If you feel that the media isn’t doing a good job of covering the positive side this story and isn’t reaching the ACA doubters and haters you know, then do something about it. Point them to this article or refer them here to read something that is directly from the chief executives of states where the ACA is working.
The Economy Didn’t Stall for Congress During Recession
by Brian T. Lynch, MSW
|
The Wealthiest US Legislators Estimated Net Worth
|
|
|
Issa, Darrell (R-Calf) House
|
$448,125,017
|
|
McCaul, Michael (R-Tex) House
|
$380,411,527
|
|
Harman, Jane (D-Calf) House
|
$326,844,751
|
|
Kerry, John (D-Mass) Senate
|
$231,722,794
|
|
Kohl, Herb (D-Wis) Senate
|
$173,538,010
|
|
Combined Wealth
|
$1,560,642,099
|


|
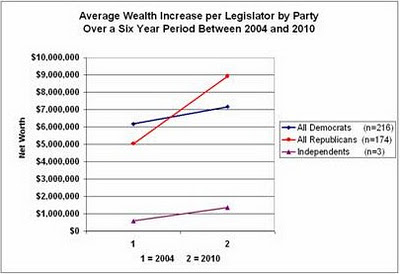
Average Wealth Increase per Legislator by Party and Chamber – 2004 and 2010
|
|||||
|
Wealth /Member in 2004
|
Wealth /Member in 2010
|
Six Year Dif /Member
|
Total % Change
|
Annual % Change
|
|
|
House Democrats (n=176)
|
$2,918,824
|
$4,408,237
|
$1,489,414
|
51.0%
|
8.50%
|
|
House Republicans (n=133)
|
$5,243,557
|
$10,111,971
|
$4,868,414
|
92.8%
|
15.47%
|
|
Senate Democrats (n=40)
|
$20,516,818
|
$19,323,256
|
-$1,193,561
|
-5.8%
|
-0.97%
|
|
Senate Republicans (n=41)
|
$4,394,130
|
$5,128,482
|
$734,352
|
16.7%
|
2.79%
|
|
Senate Independents (n=3)
|
$577,182
|
$1,359,855
|
$782,673
|
135.6%
|
22.6%
|


|
Total Wealth Increase of All US Legislators Between 2004 and 2010
|
|||||
|
Average Wealth in 2004
|
Average Wealth in 2010
|
Difference in Six Years
|
Total % Change
|
Annual % Change
|
|
|
All Members (n=393)
|
$2,213,699,631
|
$3,108,019,528
|
$894,319,897
|
40.4%
|
6.7%
|
|
All Democrats (n=216)
|
$1,334,385,659
|
$1,548,780,022
|
$214,394,363
|
16.1%
|
2.7%
|
|
All Republicans (n=174)
|
$877,552,427
|
$1,555,159,941
|
$677,607,514
|
77.2%
|
12.9%
|
|
Independents (n=3)
|
$1,731,545
|
$4,079,565
|
$2,348,020
|
135.6%
|
22.6%
|
|
Senators (n=84)
|
$1,002,563,604
|
$987,277,595
|
-$15,286,009
|
-1.5%
|
-0.3%
|
|
Congressmen (n=309)
|
$1,211,147,532
|
$2,120,971,945
|
$909,824,413
|
75.1%
|
12.5%
|
|
Average Wealth Increase Per US Legislator by Party and Chamber Between 2004 and 2010
|
|||||
|
Wealth /Member in 2004
|
Wealth /Member in 2010
|
Six Year Dif /Member
|
Total % Change
|
Annual % Change
|
|
|
All Members (n=393)
|
$5,632,823
|
$7,908,447
|
$2,275,623
|
40.4%
|
6.7%
|
|
All Democrats (n=216)
|
$6,177,711
|
$7,170,278
|
$992,566
|
16.1%
|
2.7%
|
|
All Republicans (n=174)
|
$5,043,405
|
$8,937,701
|
$3,894,296
|
77.2%
|
12.9%
|
|
Independents (n=3)
|
$577,182
|
$1,359,855
|
$782,673
|
135.6%
|
22.6%
|
|
Senators (n=84)
|
$11,935,281
|
$11,753,305
|
-$181,976
|
-1.5%
|
-0.3%
|
|
Congressmen (n-309)
|
$3,919,571
|
$6,863,987
|
$2,944,416
|
75.1%
|
12.5%
|
|
Average Wealth Increase of All US Legislators by Party Between 2004 and 2010
|
|||||
|
Average Wealth in 2004
|
Average Wealth in 2010
|
Difference in Six Years
|
Total % Change
|
Annual % Change
|
|
|
House Democrats (n=176)
|
$513,712,948
|
$775,849,769
|
$262,136,821
|
51.0%
|
8.50%
|
|
House Republicans (n=133)
|
$697,393,079
|
$1,344,892,164
|
$647,499,085
|
92.8%
|
15.47%
|
|
Senate Democrats (n=40)
|
$820,672,711
|
$772,930,253
|
-$47,742,458
|
-5.8%
|
-0.97%
|
|
Senate Republicans (n=41)
|
$180,159,348
|
$210,267,777
|
$30,108,429
|
16.7%
|
2.79%
|
|
Senate Independents (n=3)
|
$1,731,545
|
$4,079,565
|
$2,348,020
|
135.6%
|
22.6%
|
|
Average Wealth Increase per Legislator by Party and Chamber – 2004 and 2010
|
|||||
|
Wealth /Member in 2004
|
Wealth /Member in 2010
|
Six Year Dif /Member
|
Total % Change
|
Annual % Change
|
|
|
House Democrats (n=176)
|
$2,918,824
|
$4,408,237
|
$1,489,414
|
51.0%
|
8.50%
|
|
House Republicans (n=133)
|
$5,243,557
|
$10,111,971
|
$4,868,414
|
92.8%
|
15.47%
|
|
Senate Democrats (n=40)
|
$20,516,818
|
$19,323,256
|
-$1,193,561
|
-5.8%
|
-0.97%
|
|
Senate Republicans (n=41)
|
$4,394,130
|
$5,128,482
|
$734,352
|
16.7%
|
2.79%
|
|
Senate Independents (n=3)
|
$577,182
|
$1,359,855
|
$782,673
|
135.6%
|
22.6%
|
|
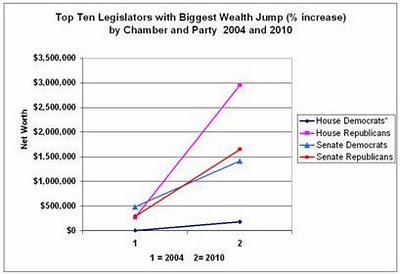
Top Ten Legislators /w Biggest Jump in Wealth ($ increase) by Party and Chamber – 2004 and 2010
|
|||||
|
Aggregated Totals
|
Average Wealth in 2004
|
Average Wealth in 2010
|
Difference in Six Years
|
Total % Change
|
Annual % Change
|
|
House Democrats (n=176)
|
$327,705,235
|
$568,142,204
|
$240,436,969
|
73.4%
|
12.2%
|
|
House Republicans (n=133)
|
$331,746,289
|
$1,005,864,579
|
$674,118,290
|
203.2%
|
33.9%
|
|
Senate Democrats (n=40)
|
$137,206,389
|
$216,341,049
|
$79,134,660
|
57.7%
|
9.6%
|
|
Senate Republicans (n=41)
|
$21,576,271
|
$81,888,741
|
$60,312,470
|
279.5%
|
46.6%
|
|
Top Ten Legislators /w Biggest Jump in Wealth ($ increase) by Party and Chamber – 2004 and 2010
|
|||||
|
Average per Legislator
|
Wealth /Member in 2004
|
Wealth /Member in 2010
|
Six Year Dif /Member
|
Total % Change
|
Annual % Change
|
|
House Democrats (n=176)
|
1,861,962
|
3,228,081
|
1,366,119
|
73.4%
|
12.2%
|
|
House Republicans (n=133)
|
2,494,333
|
7,562,892
|
5,068,559
|
203.2%
|
33.9%
|
|
Senate Democrats (n=40)
|
3,430,160
|
5,408,526
|
1,978,367
|
57.7%
|
9.6%
|
|
Senate Republicans (n=41)
|
526,251
|
1,997,286
|
1,471,036
|
279.5%
|
46.6%
|
|
Top TenLegislators /w Biggest Jump in Wealth (% increase) by Chamber & Party – 2004 and 2010
|
|||||
|
Aggregated Totals
|
Average Wealth in 2004
|
Average Wealth in 2010
|
Difference in Six Years
|
Total % Change
|
Annual % Change
|
|
House Democrats*
|
$779,531
|
$31,996,557
|
$31,217,026
|
4004.6%
|
667.4%
|
|
House Republicans
|
$35,430,212
|
$392,877,862
|
$357,447,650
|
1008.9%
|
168.1%
|
|
Senate Democrats
|
$19,415,702
|
$56,516,827
|
$37,101,125
|
191.1%
|
31.8%
|
|
Senate Republicans
|
$11,871,405
|
$67,686,976
|
$55,815,571
|
470.2%
|
78.4%
|
|
Top TenLegislators /w Biggest Jump in Wealth (% increase) by Chamber & Party – 2004 and 2010
|
|||||
|
Average per Legislator
|
Wealth /Member in 2004
|
Wealth /Member in 2010
|
Six Year Dif /Member
|
Total % Change
|
Annual % Change
|
|
House Democrats*
|
$4,429
|
$181,799
|
$177,369
|
4004.6%
|
667.4%
|
|
House Republicans
|
$266,393
|
$2,953,969
|
$2,687,576
|
470.2%
|
78.4%
|
|
Senate Democrats
|
$485,393
|
$1,412,921
|
$927,528
|
191.1%
|
31.8%
|
|
Senate Republicans
|
$289,546
|
$1,650,902
|
$1,361,355
|
470.2%
|
78.4%
|
|
* One member, P. Kennedy, accounted for most of the increase. Excluding him for the in rank on the list yeilds an increase of 1,602.6% or 267.1% annual increase.
|
|||||
Immigration Myths Hide the Benefits Says US Chamber of Commerce
From the US Chamber of Commerce: This ultra-conservative organization finally comes clean with a DATA DRIVEN VIEWPOINT support their position on immigration and how it benefits the US economically. http://www.scribd.com/doc/179652570/Immigration-Myths-and-Facts
Immigration Myths and Facts
Despite the numerous studies and carefully detailed economic reports outlining the positive effects of immigration, there is a great deal of misinformation about the impact of immigration. It is critical that policymakers and the public are educated about the facts behind these fallacies. [Says the US Chamber of Commerce]
Below I present the major points of their arguments. Please go to their website to read a detailed explanation for each of these points.
JOBS MYTH: Every job filled by an immigrant is a job that could be filled by an unemployed American.
NSA, The More We Know The More We Fear – For a Reason
The recent opinion piece (below) by Amy Zegart and Marshall Erwin of the conservative Hoover Institution suggests the NSA spy agency’s real problems are caused by our not knowing how well they protect us from terrorists. They think the NSA should focus on this rather than correcting our “misperceptions” about how they use our email and telephone data. They wrote that, “…there is no evidence the NSA is engaged in any illegal domestic snooping,” even though such evidence requires transparency and everything the NSA does is secret.
Setting aside recent proof that NSA employees do sometimes breach security protocols, we know the NSA maintains a database of electronic “envelope” information from all our calls and emails. From this information they create their meta-data analysis that reveals how closely each of us is linked to anyone else. But the NSA also has yet to deny that they are storing the content of our emails, and possibly our phone calls, in huge data storage facilities such as the recently built Utah Data Center, officially called the Intelligence Community Comprehensive National Cybersecurity Initiative Data Center. The NSA may not be previewing all this content data, but saved records can be accessed and reviewed in the future if they choose to look. By any stretch of meaning, saving private electronic content by government, even if it is never opened, is still an unreasonable government seizure prohibited by the Fourth Amendment.
So, is it reasonable for government to seize all our private emails or phone conversations providing they don’t peek? If so, then what’s to stop state or local law enforcement from doing the same. And what’s to stop the NSA from making secret allegations, obtaining secret FISA court access to stored communications or even altering those files to persecute citizens perceived as a threat? Our founding fathers would not have consented to this and neither should we. Protecting us from terrorist threats doesn’t justify suspending Fourth Amendment rights protecting us from tyranny at home.
The NSA’s image problem
To know the spy agency is not necessarily to love it.
By Amy Zegart and Marshall Erwin
November 1, 2013
In the wake of Edward Snowden‘s ongoing revelations about U.S. surveillance programs, the National Security Agency is facing the worst crisis in its 60-year history. Today, too many Americans mistakenly believe the NSA is listening to their phone calls and reading their emails. But misperception is only part of the agency’s problem. In an Oct. 5-7 YouGov national poll we commissioned, we also found the more that Americans understand the NSA’s activities, the less they support the agency. [snip]
Our poll results found the part about the public’s ignorance was true. But we did not find that ignorance bred greater distrust of the agency. [snip]
For example, Americans who accurately understood the NSA’s telephone metadata program were no more favorable toward the agency than those who mistakenly thought metadata involved snooping on the content of calls. [snip]
NSA Director Gen. Keith Alexander [has said]: “And so what’s hyped up in a lot of the reporting is that we’re listening to your phone calls. We’re reading your emails. That’s just not true.” [snip]
The NSA needs to win this debate on the merits. What we need to know is whether the agency’s telephone and Internet surveillance programs are wise and effective.
Though legal scholars will continue to debate endlessly just what “relevance” or “targeting” means, the message from these disclosures for the rest of us is this: There is no evidence that the NSA is engaged in any illegal domestic snooping operations.
For national security, the more important question now is whether these programs are good counter-terrorism policy. We have lost sight of that.
[read more at http://www.latimes.com/opinion/commentary/la-oe-zegart-nsa-effectiveness-20131101,0,1883353.story#axzz2jMeD4paf ]
Razor Blade Prices Growing Faster Than Whiskers
What is up with the price of razor blades?

There are few cheap plastic items as horribly expensive as razor blades.
It’s insane! Gentleman, where is your outrage? If these prices keep rising the length of women’s skirts and dresses will have to fall. It’s time for consumers to ask some pointed questions of companies like Gillette and Schick?
By some estimates the simple act of shaving our face can cost as much as a dollar per shave. I have been shopping for Gillette Mach 3 blades but can’t bring myself to cough up $24 bucks for eight cartridges. I went shopping again today and was shocked when I saw the unit price for them is $291 per hundred. The 4 blade Fusion cartridges are $180 more per hundred, or $469.75/ hundred.
I started looking around on the internet and discovered that the prices of these stupid plastic razors has been soaring everywhere, even in the United Kingdom. By one account on a British Website the cost of razor blades has climbed by 99% three years to as much as £3.49 (or $5.59 US) per cartridge. According to that article in costs Gillette less than 10p (about 16 cents) to make. (see below)
If you listen to business analysts or industry spokes persons it is either brand loyalty or the high cost of shaving research and marketing expences that is driving up the cost. I don’t believe it. I suspect something akin to price fixing is behind it all. I think it is time for someone to investigate the shaving industry to see why the costs are skyrocketing.
The great razor rip off: Prices of blades soar by up to 99% in just three years
By SEAN POULTER
PUBLISHED: 18:26 EST, 27 April 2012
Read more: http://www.dailymail.co.uk/news/article-2136440/The-great-razor-rip-Prices-blades-soar-99-just-years.html#ixzz2kJ3Yy3wM
Follow us: @MailOnline on Twitter | DailyMail on Facebook
The price of razor blade cartridges has surged by as much as 99 per cent in just three years – driving many men to adopt designer stubble. The cartridges cost less than 10p to make, but shoppers are being charged as much as £3.49 each. The biggest player, Gillette, has imposed a stealth price rise by cutting the number of replacement cartridges in its Mach3 Turbo packs from five to four. [snip]
Allure Man Asks: Why Are Razor Blades So Damn Expensive?
If you, like me, can remember a time before razor blades were kept behind the drugstore counter along with the cigarettes and other controlled substances, then you probably also share my amazement at just how much they cost. A four-pack of Gillette Fusion Power razor cartridges retails for $19.49 at Walgreens. That’s, what, $4.87 for a week’s worth of shaves? Outrageous!
I put this question to Jeff Raider, a cofounder of Harry’s, a new online retailer that offers shaving supplies similar in quality to the major brands but at half the price: How did razor blades become fetish objects? All of the good ones, he says, are made from similar high-grade steel, which is then precision-milled to produce a blade that’s thick at the bottom, where it’s anchored to the plastic cartridge that clips onto your razor, yet thin as a single hair at the top, where it mows down morning stubble. “The steel is a very expensive product, but the real magic of a fine razor blade is how it’s ground,” says Raider.[snip]
Good Question: Why Are Razor Blades So Expensive?
October 21, 2013
http://minnesota.cbslocal.com/2013/10/21/good-question-why-are-razor-blades-so-expensive-2/
MINNEAPOLIS (WCCO) — It can cost us anywhere between $20 and $30 dollars just to shave the hair from our faces or legs. Sometimes, the price of the razor blades is more expensive than the razors themselves.
So, why are razor blades so expensive? Good Question. [snip] Erin Lash is a senior equity analyst at Morningstar, anindependent investment research firm. She covers Gillette (owned by Proctor & Gamble), one of the the two dominant players in the razor market. Schick (owned by Energizer Holdings, Inc.) is the other company.
Lash says part of the reason razor blades are so expensive is because consumers are loyal to the brand.
“Once you buy a particular razor, there’s no substitution for the razor blade,” she said. “Companies have a great ability to charge up for the blade once you’re locked into the actual product,” she said.[snip
Why Are Razors So Darn Expensive?
Because shaving is a science.
So let’s do the math. In the photo above, a women’s package of razors costs $18.79 for five cartridges. If each cartridge lasts about a week, that comes out to about 54 cents a shave. Seems pricey, but what exactly goes into making a razor? Those stainless steel blades that you see are only a small part of the final product. [snip]
A Word About My Free Rooftop Solar
by Brian T. Lynch, MSW
Let me tell you about my free rooftop solar energy system which I recently had installed.

I’ve wanted solar energy for a long time, mostly because my wife and I are concerned about the global warming. We didn’t convert years ago because of the high cost and slow rate of return on the initial investment. We live in Northern New Jersey which has considerably less sunlight than, say, Arizona. When I first looked into it, solar panels were far less efficient than they are today so the cost/benefit for us couldn’t be justified.
Now we are retired and improved solar panels have really lowered investment recovery times, but we may want to downsize or relocate in the next few years. We don’t want a solar energy project that won’t be paid off before we sell.
The solution for us was one of the new solar energy lease program that installs and maintains the entire system for free over a period of years. The solar panels send power directly to the power grid in an arrangement with the utility companies know as “net metering”. The solar electricity generated is deducted by the utility company from the power that I use. When we generate more power than we use the utility company gives us a credit. On months when we use more power than we generate we apply the accumulated credits and pay for any difference.
There is a catch, of course. The company who owns the system on our roof also owns the electricity it generates. We pay them for the solar electricity that we use, power which the original utility company no longer supplies. In effect, the solar energy company becomes our energy provider. For the use of our roof the solar company sells us this electricity at a discounted rate. In our case we paid nothing for the system, we will pay nothing for its maintenance over the next 20 years and we will save on our electricity bill each month. Our solar electric rate is structured to increase the amount we will save each year over time relative to our current provider. We were told that over twenty years we should save about eighteen-thousand dollars by switching to solar through this lease program.
The real beneficiary in all this is the environment. Over the course of one month we prevent over a quarter ton of carbon from entering the atmosphere. That’s three tons a year or sixty tons over the next twenty years. Through conservation measures our electric use is already half what a typical homeowner uses, so most people would save even more on carbon emissions. If everyone on our block had rooftop solar the atmosphere would be spared well over 3,000 tons of carbon a year.
How did we pick a solar energy company? I would like to say we shopped and compared, but it didn’t happen that way. I stopped to talk with a person offering information on rooftop solar at a kiosk in Home Depot. This lead me to invite a sales representative from Rooftop Diagnostic to come to our home. The representative explained how the lease option worked and confirmed that our house was a candidate for a solar based on our homes orientation and the amount of sunlight it gets. Rooftop Diagnostics only designs, installs and maintains the system for a company called Enphase Energy and neither of these two companies are affiliated with Home Depot.
Under a net metering arrangement homeowners are not allowed to produce more power than they use. This means that rooftop solar installations can’t be designed to produce more than 100% of the homeowners average annual energy use. The initial electricity rate the solar company charges is somewhat negotiable, but it should be at or slightly below what the utility company charges now. Under our Enphase Energy contract our initial electric rate will increase by 3.5% per year, which they say is half of the historic rate increase for our current energy provider. That might sound like a lot, but the inflation rate over the past 10 years is 2.3%, so inflation alone accounts for most of the increase. In our specific case, our energy charge would start at about $36.00 per month and it will end up about $67.00 per month in twenty years. The power utilities also charges a delivery service charge each month based on energy use. Since about 96% of our electricity will come from the electricity generated on our roof, our delivery service charge will be 96% less per month as well. Also, while our current electric rates vary seasonally, our solar energy rates remain the same each month.
After I first met with the solar representative, I searched the internet for more information to comparison shop, but didn’t find what I was looking for. I wanted a database listing companies that provide solar leasing options but there are none at present. A lot of companies on the internet offer solar instillations but important details are lacking. Unfortunately, internet information about solar electric companies is not as organized as is information about the sham alternative energy retailers that “compete” to sell you lower electric rates. These companies are wholesale purchasers of electricity who offer crazy gimmicks and low introductory rates to get you to buy power from them. It is a dog and pony show masquerading as a competitive energy market, but the only real competition the utility companies face is from the nascent “distributed energy” alternatives such as rooftop solar and wind power systems. Even though these true alternative energy sources are a tiny fraction of the energy market, the big utility companies are already organizing to protect their business model and market shares. If you think you might be interested in a rooftop solar system, to buy or lease, it would be wise to act soon because the current financial incentives will disappear if the energy industry has its way.
[PS: If you live in New Jersey and already have a rooftop system from Rooftop Diagnostics, they will pay you a referral fee for any new customers you refer to them. Other companies might offer similar incentives,so if you are thinking about getting a system, check with friends and family members who might benefit from this incentive program. To be clear, I am not soliciting referrals and I have no pecuniary motivation in writing this post.]
Snippets: Toxic Stress and New Ways to Combat the Impact of Child Abuse and Neglect
What follows is a snip-it of an excellent article from the Opinionator section of the New York Times by David Bornstein. Within the article are hyperlinks to excellent source material on childhood toxic stress, its impact on children and new methods to prevent harm or treat children who are exposed to toxic stress. I have taken snippets of each of these hyperlinks to create an annotated index to the sources from Mr. Bornstein’s article. I hope that this will encourage further reading and understanding on this topic. Having spend 31 years as a social worker in child protective services it has been my experience that chronic and repetitive stress on children is both pervasive and incredibly damaging. It takes new protective service workers years of experience to recognize toxic stress and fully appreciate how damaging it truly is. The whole field of protective services is more oriented towards responding to physical abuse and acute safety risks than it is to chronic neglect or repetitive lower level trauma. – Brian T. Lynch, MSW
Protecting Children From Toxic Stress
New York Times – October 30, 2013
Imagine if scientists discovered a toxic substance that increased the risks of cancer, diabetes and heart, lung and liver disease for millions of people. Something that also increased one’s risks for smoking, drug abuse, suicide, teen pregnancy, sexually transmitted disease, domestic violence and depression — and simultaneously reduced the chances of succeeding in school, performing well on a job and maintaining stable relationships? It would be comparable to hazards like lead paint, tobacco smoke and mercury. We would do everything in our power to contain it and keep it far away from children. Right?
Well, there is such a thing, but it’s not a substance. It’s been called “toxic stress.” For more than a decade, researchers have understood that frequent or continual stress on young children who lack adequate protection and support from adults, is strongly associated with increases in the risks of lifelong health and social problems, including all those listed above.
[read more: http://opinionator.blogs.nytimes.com/2013/10/30/protecting-children-from-toxic-stress/?_r=0 ]
Toxic stress response: Occurs when a child experiences strong, frequent, and/or prolonged adversity—such as physical or emotional abuse, chronic neglect, caregiver substance abuse or mental illness, exposure to violence, and/or the accumulated burdens of family economic hardship—without adequate adult support. This kind of prolonged activation of the stress response systems can disrupt the development of brain architecture and other organ systems, and increase the risk for stress-related disease and cognitive impairment, well into the adult years.
When toxic stress response occurs continually, or is triggered by multiple sources, it can have a cumulative toll on an individual’s physical and mental health—for a lifetime. The more adverse experiences in childhood, the greater the likelihood of developmental delays and later health problems, including heart disease, diabetes, substance abuse, and depression. Research also indicates that supportive, responsive relationships with caring adults as early in life as possible can prevent or reverse the damaging effects of toxic stress response.
[read more: http://developingchild.harvard.edu/topics/science_of_early_childhood/toxic_stress_response/ ]
Centers For Disease Control and Prevention
http://www.cdc.gov/ace/index.htm
Survey shows 1 in 5 Iowans have 3 or more adverse childhood experiences
October 14, 2013By Jane Ellen Stevensin
Iowa’s 2012 ACE survey found that 55 percent of Iowans have at least one adverse childhood experience, while one in five of the state’s residents have an ACE score of 3 or higher.
In the Iowa study, there was more emotional abuse than physical and sexual abuse, while adult substance abuse was higher than other household dysfunctions.
This survey echoed the original CDC ACE Study in that as the number of types of adverse childhood experiences increase, the risk of chronic health problems — such as diabetes, depression, heart disease and cancer — increases. So does violence, becoming a victim of violence, and missing work days.
[read more: http://acestoohigh.com/2013/10/14/survey-shows-1-in-5-iowans-have-3-or-more-adverse-childhood-experiences/ ]
From the American Academy of Pediatrics
Technical Report
The Lifelong Effects of Early Childhood Adversity and Toxic Stress
- 1. Benjamin S. Siegel, MD,
- 2. Mary I. Dobbins, MD,
- 3. Marian F. Earls, MD,
- 4. Andrew S. Garner, MD, PhD,
- 5. Laura McGuinn, MD,
- 6. John Pascoe, MD, MPH, and
- 7. David L. Wood, MD
ABSTRACT
Advances in fields of inquiry as diverse as neuroscience, molecular biology, genomics, developmental psychology, epidemiology, sociology, and economics are catalyzing an important paradigm shift in our understanding of health and disease across the lifespan. This converging, multidisciplinary science of human development has profound implications for our ability to enhance the life prospects of children and to strengthen the social and economic fabric of society. Drawing on these multiple streams of investigation, this report presents an ecobiodevelopmental framework that illustrates how early experiences and environmental influences can leave a lasting signature on the genetic predispositions that affect emerging brain architecture and long-term health. The report also examines extensive evidence of the disruptive impacts of toxic stress, offering intriguing insights into causal mechanisms that link early adversity to later impairments in learning, behavior, and both physical and mental well-being. The implications of this framework for the practice of medicine, in general, and pediatrics, specifically, are potentially transformational. They suggest that many adult diseases should be viewed as developmental disorders that begin early in life and that persistent health disparities associated with poverty, discrimination, or maltreatment could be reduced by the alleviation of toxic stress in childhood. [snip]
[read more: http://pediatrics.aappublications.org/content/129/1/e232.full ]
WORKING PAPER #3
Excessive Stress Disrupts the Architecture of the Developing Brain
New research suggests that exceptionally stressful experiences early in life may have long-term consequences for a child’s learning, behavior, and both physical and mental health. Some types of “positive stress” in a child’s life—overcoming the challenges and frustrations of learning a new, difficult task, for instance—can be beneficial. Severe, uncontrollable, chronic adversity—what this report defines as “toxic stress”—on the other hand, can produce detrimental effects on developing brain architecture as well as on the chemical and physiological systems that help an individual adapt to stressful events. This has implications for many policy issues, including family and medical leave, child care quality and availability, mental health services, and family support programs. This report from the National Scientific Council on the Developing Child explains how significant adversity early in life can alter—in a lasting way—a child’s capacity to learn and to adapt to stressful situations, how sensitive and responsive caregiving can buffer the effects of such stress, and how policies could be shaped to minimize the disruptive impacts of toxic stress on young children.
Suggested citation: National Scientific Council on the Developing Child (2005). Excessive Stress Disrupts the Architecture of the Developing Brain: Working Paper No. 3. Retrieved from http://www.developingchild.harvard.edu
Strengthening Adult Capacities to Improve Child Outcomes: A New Strategy for Reducing Integenerational Poverty
Jack P. Shonkoff, Harvard University – Posted April 22, 2012
[snip]
It’s clear that high-quality early childhood programs can make a measurable difference for children in poverty, but we must do more. Advances in neuroscience, molecular biology, and the behavioral sciences provide the evidence needed to build on best practices and to forge new ideas that can address the factors that contribute to intergenerational poverty. One promising path is to focus on fostering the skills in adults that allow them to be both better parents and better employees.
Science tells us that children who experience significant adversity without the buffering protection of supportive adults can suffer serious lifelong consequences. Such “toxic stress” in the early years can disrupt developing brain architecture and other maturing biological systems in a way that leads to poor outcomes in learning, behavior, and health. [snip] …[T]he goal is to prevent or mitigate the consequences of toxic stress by buffering young children from abuse or neglect, exposure to violence, parental mental illness or substance abuse, and other serious threats to their well-being.
Success in this area requires adults and communities to provide sufficient protection and supports that will help young children develop strong, adaptive capacities. Since many caregivers with limited education and low income have underdeveloped adaptive skills of their own, interventions that focus on adult capacity-building offer promising opportunities for greater impacts on children.
One area of development that appears to be particularly ripe for innovation is the domain of executive functioning. These skills include the ability to focus and sustain attention, set goals and make plans, follow rules, solve problems, monitor actions, delay gratification, and control impulses.[snip]
[ See more at: http://www.spotlightonpoverty.org/ExclusiveCommentary.aspx?id=7a0f1142-f33b-40b8-82eb-73306f86fb74#sthash.4XsuGXPI.dpuf ]
Stress reactivity and attachment security.
Gunnar MR, Brodersen L, Nachmias M, Buss K, Rigatuso J.
Source
Institute of Child Development, University of Minnesota, Minneapolis 55455, USA.
Abstract
Seventy-three 18-month-olds were tested in the Ainsworth Strange Situation. These children were a subset of 83 infants tested at 2, 4, 6, and 15 months during their well-baby examinations with inoculations. Salivary cortisol, behavioral distress, and maternal responsiveness measures obtained during these clinic visits were examined in relation to attachment classifications. In addition, parental report measures of the children’s social fearfulness in the 2nd year of life were used to classify the children into high-fearful versus average- to low-fearful groups. In the 2nd year, the combination of high fearfulness and insecure versus secure attachment was associated with higher cortisol responses to both the clinic exam-inoculation situation and the Strange Situation. Thus, attachment security moderates the physiological consequences of fearful, inhibited temperament. Regarding the 2-, 4-, and 6-month data, later attachment security was related to greater maternal responsiveness and lower cortisol baselines. Neither cortisol nor behavioral reactivity to the inoculations predicted later attachment classifications. There was some suggestion, however, that at their 2-month checkup, infants who would later be classified as insecurely attached exhibited larger dissociations between the magnitude of their behavioral and hormonal response to the inoculations. Greater differences between internal (hormonal) and external (crying) responses were also negatively correlated with maternal responsiveness and positively correlated with pretest cortisol levels during these early months of life.
[read more: http://www.ncbi.nlm.nih.gov/pubmed/8666128 ]
Child FIRST
HIGHLIGHTS
- Intervention: A home visitation program for low-income families with young children at high risk of emotional, behavioral, or developmental problems, or child maltreatment.
- Evaluation Methods: A well-conducted randomized controlled trial.
- Key Findings: At the three-year follow-up, a 33% reduction in families’ involvement with child protective services (CPS) for possible child maltreatment. At the one-year follow-up, 40-70% reductions in serious levels of (i) child conduct and language development problems, and (ii) mothers’ psychological distress.
- Other: A study limitation is that its sample was geographically concentrated in Bridgeport, Connecticut. Replication of these findings in a second trial, in another setting, would be desirable to confirm the initial results and establish that they generalize to other settings where the intervention might be implemented.
Download a printable version of this evidence summary (pdf, 4 pages)
Effects of Child FIRST one year after random assignment:
Compared to the control group, children in the Child FIRST group were –
- 68% less likely to have clinically-concerning language development problems, as measured by a trained assessor (10.5% of Child FIRST children had such problems versus 33.3% of control group children).
- 42% less likely to have clinically-concerning externalizing behaviors, such as aggression or impulsiveness, as reported by their mothers (17.0% of Child FIRST children versus 29.1% of control group children).
Compared to the control group, mothers in the Child FIRST group were –
- 64% less likely to have clinically-concerning levels of psychological distress, based on self-reports (14.0% of Child FIRST mothers versus 39.0% of the control group mothers).
- The study did not find statistically-significant effects on (i) the percent of children with clinically-concerning internalizing behaviors (e.g., depression or anxiety); (ii) the percent of children with clinically-concerning dysregulation (e.g., sleep or eating problems); (iii) the percent of mothers with clinically-concerning parenting stress; or (iv) the percent of mothers with clinically-concerning depression.3
[read more: http://toptierevidence.org/programs-reviewed/child-first ]
Research Finds a High Rate of Expulsions in Preschool
By TAMAR LEWIN
New York Times – Published: May 17, 2005
So what if typical 3-year-olds are just out of diapers, still take a daily nap and can’t tie their shoes? They are plenty old enough to be expelled, the first national study of expulsion rates in prekindergarten programs has found.
In fact, preschool children are three times as likely to be expelled as children in kindergarten through 12th grade, according to the new study, by researchers from the Yale Child Study Center.
[read more: http://www.nytimes.com/2005/05/17/education/17expel.html?_r=0 ]
Preschool and child care expulsion and suspension: Rates and predictors in one state.
Gilliam, Walter S.; Shahar, Golan
Infants & Young Children, Vol 19(3), Jul-Sep 2006, 228-245. doi: 10.1097/00001163-200607000-00007
ABSTRACT : Rates and predictors of preschool expulsion and suspension were examined in a randomly selected sample of Massachusetts preschool teachers (N = 119). During a 12-month period, 39% of teachers reported expelling at least one child, and 15% reported suspending. The preschool expulsion rate was 27.42 per 1000 enrollees, more than 34 times the Massachusetts K-12 rate and more than 13 times the national K-12 rate. Suspension rates for preschoolers were less than that for K-12. Larger classes, higher proportion of 3-year-olds in the class, and elevated teacher job stress predicted increased likelihood of expulsion. [snip]
[read more: http://psycnet.apa.org/psycinfo/2009-04570-007 ]
Traumatic and stressful events in early childhood: Can treatment help those at highest risk?
Chandra Ghosh Ippen, William W. Harris, Patricia Van Horn, Alicia F. Lieberman
ABSTRACT: This study involves a reanalysis of data from a randomized controlled trial to examine whether child–parent psychotherapy (CPP), an empirically based treatment focusing on the parent–child relationship as the vehicle for child improvement, is efficacious for children who experienced multiple traumatic and stressful life events (TSEs)
[read more: http://www.sciencedirect.com/science/article/pii/S0145213411001499 ]
Listening to a Baby’s Brain: Changing the Pediatric Checkup to Reduce Toxic Stress
Listening to a baby’s heartbeat. Examining a toddler’s ears. Testing a preschooler for exposure to lead. These critical screenings have long been the hallmarks of early childhood checkups. Now, leading pediatricians are recommending major changes to the checkups of the future. The American Academy of Pediatrics (AAP) wants primary care doctors to screen their youngest patients for social and emotional difficulties that could be early signs of toxic stress. Read more >>
[read more: http://developingchild.harvard.edu/resources/stories_from_the_field/tackling_toxic_stress/ ]
From the American Academy of Pediatrics
Policy Statement
Early Childhood Adversity, Toxic Stress, and the Role of the Pediatrician: Translating Developmental Science Into Lifelong Health
Andrew S. Garner, MD, PhD, Jack P. Shonkoff, MD, Benjamin S. Siegel, MD, Mary I. Dobbins, MD, Marian F. Earls, MD, Andrew S. Garner, MD, PhD, Laura McGuinn, MD, John Pascoe, MD, MPH, David L. Wood, MD
ABSTRACT : [snip] To this end, AAP endorses a developing leadership role for the entire pediatric community—one that mobilizes the scientific expertise of both basic and clinical researchers, the family-centered care of the pediatric medical home, and the public influence of AAP and its state chapters—to catalyze fundamental change in early childhood policy and services. AAP is committed to leveraging science to inform the development of innovative strategies to reduce the precipitants of toxic stress in young children and to mitigate their negative effects on the course of development and health across the life span.
[read more: http://pediatrics.aappublications.org/content/129/1/e224.full.html ]
Top of Form
aces connection
HEALTHY, HAPPY KIDS GROW UP TO CREATE A HEALTHY, HAPPY WORLD.
This is a community of practice network. We use trauma-informed practices to prevent ACEs & further trauma, and to increase resilience.
[read more: http://acesconnection.com/ ]
ABOUT DAVID BORNSTEIN:
David Bornstein is the author of “How to Change the World,” which has been published in 20 languages, and “The Price of a Dream: The Story of the Grameen Bank,” and is co-author of “Social Entrepreneurship: What Everyone Needs to Know.” He is a co-founder of theSolutions Journalism Network, which supports rigorous reporting about responses to social problems.
