Home » Posts tagged 'Economy' (Page 2)
Tag Archives: Economy
Austerity for Dummies, Like Us
Imagine owning a small manufacturing business with 25 happy employees. After paying overhead , suppliers, employees, benefits and your Potter’s Bank business loan you have just enough to get by.
One day your suppliers find they can’t get raw materials because of artifical shortages and price spikes caused by futures speculators that work at bank. The suppliers they need to borrow money to pay for higher priced raw materials, at least until they can adjust with worker layoff and cutbacks. Potter’s Bank charges them higher interest rates because now they’re “risky” borrowers.
Your suppliers must pass along their higher costs to you, so now its your turn to cut wages, benefits and hours. Your employees grumble and can’t keep up with the workload. Production stalls, but also sales start to drop because all the affected workers are also your customers.
One day you discover you can’t pay the bank loan, so you go to Potter’s Bank to renegotiate terms. Potter tells you what he has been telling everyone:
“You’re a credit risk! Your workers make too much and the cost of their benefits is rising. Cut benefits, cut wages, layoff some of those lazy workers and you will be more efficient. Only then will I loan you the money you need. Do as I ask or Ill raise your interest rates further or foreclose on your business.”
This is the austerity trap. Bankers use their leverage to play both ends against the middle forcing both businesses and governments to be more labor efficient. It squeezes more production out of fewer workers for lower wages and benefits. It also suppresses consumption because fewer consumers are employed and those who work have less income or job security. It doesn’t matter if austerity is imposed on businesses or the public sector, the effects are the same.
Imposing austerity is like digging a hole in the economy, the more you dig the deeper the hole. It is good for bankers but bad for workers. It increases corporate profits but reduces personal incomes (except for the very rich). It shrinks the size of government but reduces support to the poor and unemployed people it creates. What ever hurts workers hurts consumers which suppresses consumption and depresses the economy, which then hurts more workers in a literally vicious cycle.
Making debt reduction a priority during a recession, rather than creating jobs and putting money back into the hands of consumers, is austerity. As the article below points out with a graph, shutting down the government and causing the government sequester to lower government spending at this time has hurt recovery. It is the wrong prescription.
In a World Without Austerity…
By Adam Hersh | October 4, 2013
http://www.americanprogress.org/issues/economy/news/2013/10/04/76305/in-a-world-without-austerity/
Thanks to the federal government shutdown, there is an absence of new U.S. job market data for September 2013. Let’s take a moment to imagine the kind of economy we might see in the United States today had we not just lived through three years of fiercely divisive politicking for fiscal austerity—sharp cuts to public services and investments, as well as cuts to taxes on America’s wealthiest people.
If federal and state governments had not adopted policies of fiscal austerity, today’s jobs report from the Department of Labor would likely be telling us, as shown in Figure 1:
- U.S. employers added more than 260,000 jobs in September.
- The unemployment rate for September fell below 6 percent.
- Since December 2010, the U.S. economy has added more than 8.2 million new jobs—or 2.4 million more than have actually been added.

The Economy Didn’t Stall for Congress During Recession
by Brian T. Lynch, MSW
|
The Wealthiest US Legislators Estimated Net Worth
|
|
|
Issa, Darrell (R-Calf) House
|
$448,125,017
|
|
McCaul, Michael (R-Tex) House
|
$380,411,527
|
|
Harman, Jane (D-Calf) House
|
$326,844,751
|
|
Kerry, John (D-Mass) Senate
|
$231,722,794
|
|
Kohl, Herb (D-Wis) Senate
|
$173,538,010
|
|
Combined Wealth
|
$1,560,642,099
|


|
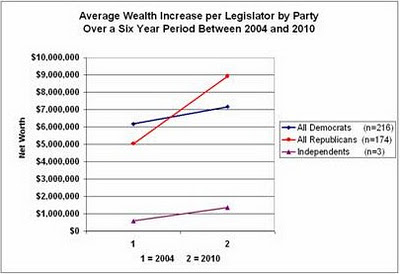
Average Wealth Increase per Legislator by Party and Chamber – 2004 and 2010
|
|||||
|
Wealth /Member in 2004
|
Wealth /Member in 2010
|
Six Year Dif /Member
|
Total % Change
|
Annual % Change
|
|
|
House Democrats (n=176)
|
$2,918,824
|
$4,408,237
|
$1,489,414
|
51.0%
|
8.50%
|
|
House Republicans (n=133)
|
$5,243,557
|
$10,111,971
|
$4,868,414
|
92.8%
|
15.47%
|
|
Senate Democrats (n=40)
|
$20,516,818
|
$19,323,256
|
-$1,193,561
|
-5.8%
|
-0.97%
|
|
Senate Republicans (n=41)
|
$4,394,130
|
$5,128,482
|
$734,352
|
16.7%
|
2.79%
|
|
Senate Independents (n=3)
|
$577,182
|
$1,359,855
|
$782,673
|
135.6%
|
22.6%
|


|
Total Wealth Increase of All US Legislators Between 2004 and 2010
|
|||||
|
Average Wealth in 2004
|
Average Wealth in 2010
|
Difference in Six Years
|
Total % Change
|
Annual % Change
|
|
|
All Members (n=393)
|
$2,213,699,631
|
$3,108,019,528
|
$894,319,897
|
40.4%
|
6.7%
|
|
All Democrats (n=216)
|
$1,334,385,659
|
$1,548,780,022
|
$214,394,363
|
16.1%
|
2.7%
|
|
All Republicans (n=174)
|
$877,552,427
|
$1,555,159,941
|
$677,607,514
|
77.2%
|
12.9%
|
|
Independents (n=3)
|
$1,731,545
|
$4,079,565
|
$2,348,020
|
135.6%
|
22.6%
|
|
Senators (n=84)
|
$1,002,563,604
|
$987,277,595
|
-$15,286,009
|
-1.5%
|
-0.3%
|
|
Congressmen (n=309)
|
$1,211,147,532
|
$2,120,971,945
|
$909,824,413
|
75.1%
|
12.5%
|
|
Average Wealth Increase Per US Legislator by Party and Chamber Between 2004 and 2010
|
|||||
|
Wealth /Member in 2004
|
Wealth /Member in 2010
|
Six Year Dif /Member
|
Total % Change
|
Annual % Change
|
|
|
All Members (n=393)
|
$5,632,823
|
$7,908,447
|
$2,275,623
|
40.4%
|
6.7%
|
|
All Democrats (n=216)
|
$6,177,711
|
$7,170,278
|
$992,566
|
16.1%
|
2.7%
|
|
All Republicans (n=174)
|
$5,043,405
|
$8,937,701
|
$3,894,296
|
77.2%
|
12.9%
|
|
Independents (n=3)
|
$577,182
|
$1,359,855
|
$782,673
|
135.6%
|
22.6%
|
|
Senators (n=84)
|
$11,935,281
|
$11,753,305
|
-$181,976
|
-1.5%
|
-0.3%
|
|
Congressmen (n-309)
|
$3,919,571
|
$6,863,987
|
$2,944,416
|
75.1%
|
12.5%
|
|
Average Wealth Increase of All US Legislators by Party Between 2004 and 2010
|
|||||
|
Average Wealth in 2004
|
Average Wealth in 2010
|
Difference in Six Years
|
Total % Change
|
Annual % Change
|
|
|
House Democrats (n=176)
|
$513,712,948
|
$775,849,769
|
$262,136,821
|
51.0%
|
8.50%
|
|
House Republicans (n=133)
|
$697,393,079
|
$1,344,892,164
|
$647,499,085
|
92.8%
|
15.47%
|
|
Senate Democrats (n=40)
|
$820,672,711
|
$772,930,253
|
-$47,742,458
|
-5.8%
|
-0.97%
|
|
Senate Republicans (n=41)
|
$180,159,348
|
$210,267,777
|
$30,108,429
|
16.7%
|
2.79%
|
|
Senate Independents (n=3)
|
$1,731,545
|
$4,079,565
|
$2,348,020
|
135.6%
|
22.6%
|
|
Average Wealth Increase per Legislator by Party and Chamber – 2004 and 2010
|
|||||
|
Wealth /Member in 2004
|
Wealth /Member in 2010
|
Six Year Dif /Member
|
Total % Change
|
Annual % Change
|
|
|
House Democrats (n=176)
|
$2,918,824
|
$4,408,237
|
$1,489,414
|
51.0%
|
8.50%
|
|
House Republicans (n=133)
|
$5,243,557
|
$10,111,971
|
$4,868,414
|
92.8%
|
15.47%
|
|
Senate Democrats (n=40)
|
$20,516,818
|
$19,323,256
|
-$1,193,561
|
-5.8%
|
-0.97%
|
|
Senate Republicans (n=41)
|
$4,394,130
|
$5,128,482
|
$734,352
|
16.7%
|
2.79%
|
|
Senate Independents (n=3)
|
$577,182
|
$1,359,855
|
$782,673
|
135.6%
|
22.6%
|
|
Top Ten Legislators /w Biggest Jump in Wealth ($ increase) by Party and Chamber – 2004 and 2010
|
|||||
|
Aggregated Totals
|
Average Wealth in 2004
|
Average Wealth in 2010
|
Difference in Six Years
|
Total % Change
|
Annual % Change
|
|
House Democrats (n=176)
|
$327,705,235
|
$568,142,204
|
$240,436,969
|
73.4%
|
12.2%
|
|
House Republicans (n=133)
|
$331,746,289
|
$1,005,864,579
|
$674,118,290
|
203.2%
|
33.9%
|
|
Senate Democrats (n=40)
|
$137,206,389
|
$216,341,049
|
$79,134,660
|
57.7%
|
9.6%
|
|
Senate Republicans (n=41)
|
$21,576,271
|
$81,888,741
|
$60,312,470
|
279.5%
|
46.6%
|
|
Top Ten Legislators /w Biggest Jump in Wealth ($ increase) by Party and Chamber – 2004 and 2010
|
|||||
|
Average per Legislator
|
Wealth /Member in 2004
|
Wealth /Member in 2010
|
Six Year Dif /Member
|
Total % Change
|
Annual % Change
|
|
House Democrats (n=176)
|
1,861,962
|
3,228,081
|
1,366,119
|
73.4%
|
12.2%
|
|
House Republicans (n=133)
|
2,494,333
|
7,562,892
|
5,068,559
|
203.2%
|
33.9%
|
|
Senate Democrats (n=40)
|
3,430,160
|
5,408,526
|
1,978,367
|
57.7%
|
9.6%
|
|
Senate Republicans (n=41)
|
526,251
|
1,997,286
|
1,471,036
|
279.5%
|
46.6%
|
|
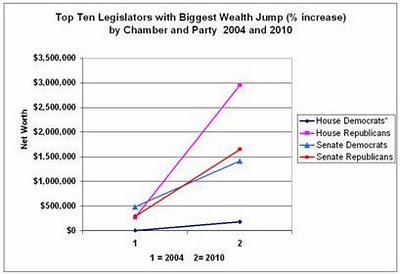
Top TenLegislators /w Biggest Jump in Wealth (% increase) by Chamber & Party – 2004 and 2010
|
|||||
|
Aggregated Totals
|
Average Wealth in 2004
|
Average Wealth in 2010
|
Difference in Six Years
|
Total % Change
|
Annual % Change
|
|
House Democrats*
|
$779,531
|
$31,996,557
|
$31,217,026
|
4004.6%
|
667.4%
|
|
House Republicans
|
$35,430,212
|
$392,877,862
|
$357,447,650
|
1008.9%
|
168.1%
|
|
Senate Democrats
|
$19,415,702
|
$56,516,827
|
$37,101,125
|
191.1%
|
31.8%
|
|
Senate Republicans
|
$11,871,405
|
$67,686,976
|
$55,815,571
|
470.2%
|
78.4%
|
|
Top TenLegislators /w Biggest Jump in Wealth (% increase) by Chamber & Party – 2004 and 2010
|
|||||
|
Average per Legislator
|
Wealth /Member in 2004
|
Wealth /Member in 2010
|
Six Year Dif /Member
|
Total % Change
|
Annual % Change
|
|
House Democrats*
|
$4,429
|
$181,799
|
$177,369
|
4004.6%
|
667.4%
|
|
House Republicans
|
$266,393
|
$2,953,969
|
$2,687,576
|
470.2%
|
78.4%
|
|
Senate Democrats
|
$485,393
|
$1,412,921
|
$927,528
|
191.1%
|
31.8%
|
|
Senate Republicans
|
$289,546
|
$1,650,902
|
$1,361,355
|
470.2%
|
78.4%
|
|
* One member, P. Kennedy, accounted for most of the increase. Excluding him for the in rank on the list yeilds an increase of 1,602.6% or 267.1% annual increase.
|
|||||
Immigration Myths Hide the Benefits Says US Chamber of Commerce
From the US Chamber of Commerce: This ultra-conservative organization finally comes clean with a DATA DRIVEN VIEWPOINT support their position on immigration and how it benefits the US economically. http://www.scribd.com/doc/179652570/Immigration-Myths-and-Facts
Immigration Myths and Facts
Despite the numerous studies and carefully detailed economic reports outlining the positive effects of immigration, there is a great deal of misinformation about the impact of immigration. It is critical that policymakers and the public are educated about the facts behind these fallacies. [Says the US Chamber of Commerce]
Below I present the major points of their arguments. Please go to their website to read a detailed explanation for each of these points.
JOBS MYTH: Every job filled by an immigrant is a job that could be filled by an unemployed American.
Labor Day – A Day for Reflection
Labor Day. For much of the world this is a day of reflection to honor the martyrs who stood up to wealthy capitalists in the fight for dignified employment, the eight-hour workday and the five-day work week. It is a day to honor those who sacrificed their lives so that we might be home in time to eat dinner with our families and to have Saturday’s off to watch our children play baseball or soccer. It is a reminder that many of the blessings we take for granted today came at a terrible price. If we forget how we got these benefits they will slowly erode over time and history will reap itself.
Much of the world celebrates Labor Day not in August, but in May. Have you ever wondered why? Would you be surprised to learn that labor celebrations around the world commemorate events that took place in Chicago in 1816? Students of history will recognize this as the Haymarket, or May Day Massacre. Below is one account from the Encyclopedia of Chicago History via Wikipedia. http://www.encyclopedia.chicagohistory.org/pages/571.html
Haymarket and May DayLABOR UNREST, 1886 (MAP)
On May 1, 1886, Chicago unionists, reformers, socialists,anarchists, and ordinary workers combined to make the city the center of the national movement for an eight-hour day. Between April 25 and May 4, workers attended scores of meetings and paraded through the streets at least 19 times. On Saturday, May 1, 35,000 workers walked off their jobs. Tens of thousands more, both skilled and unskilled, joined them on May 3 and 4. Crowds traveled from workplace to workplace urging fellow workers to strike. Many now adopted the radical demand of eight hours’ work for ten hours’ pay. Police clashed with strikers at least a dozen times, three with shootings. At the McCormick reaper plant, a long-simmering strike erupted in violence on May 3, and police fired at strikers, killing at least two. Anarchists called a protest meeting at the West Randolph Street Haymarket, advertising it in inflammatory leaflets, one of which called for “Revenge!” The crowd gathered on the evening of May 4 on Des Plaines Street, just north of Randolph, was peaceful, and Mayor Carter H. Harrison, who attended, instructedpolice not to disturb the meeting. But when one speaker urged the dwindling crowd to “throttle” the law, 176 officers under Inspector John Bonfield marched to the meeting and ordered it to disperse. Then someone hurled a bomb at the police, killing one officer instantly. Police drew guns, firing wildly. Sixty officers were injured, and eight died; an undetermined number of the crowd were killed or wounded. The Haymarket bomb seemed to confirm the worst fears of business leaders and others anxious about the growing labor movement and radical influence in it. Mayor Harrison quickly banned meetings and processions. Police made picketing impossible and suppressed the radical press. Chicago newspapers publicized unsubstantiated police theories of anarchist conspiracies, and they published attacks on the foreign-born and calls for revenge, matching the anarchists in inflammatory language. The violence demoralized strikers, and only a few well-organized strikes continued. Police arrested hundreds of people, but never determined the identity of the bomb thrower. Amidst public clamor for revenge, however, eight anarchists, including prominent speakers and writers, were tried for murder. The partisan Judge Joseph E. Gary conducted the trial, and all 12 jurors acknowledged prejudice against the defendants. Lacking credible evidence that the defendants threw the bomb or organized the bomb throwing, prosecutors focused on their writings and speeches. The jury, instructed to adopt a conspiracy theory without legal precedent, convicted all eight. Seven were sentenced to death. The trial is now considered one of the worst miscarriages of justice in American history. Many Americans were outraged at the verdicts, but legal appeals failed. Two death sentences were commuted, but on November 11, 1887, four defendants were hanged in the Cook County jail; one committed suicide. Hundreds of thousands turned out for the funeral procession of the five dead men. In 1893, Governor John Peter Altgeld granted the three imprisoned defendants absolute pardon, citing the lack of evidence against them and the unfairness of the trial. Inspired by the American movement for a shorter workday, socialists and unionists around the world began celebrating May 1, or “May Day,” as an international workers’ holiday. In the twentieth century, the Soviet Union and other Communist countries officially adopted it. The Haymarket tragedy is remembered throughout the world in speeches, murals, and monuments. American observance was strongest in the decade before World War I. During the Cold War, many Americans saw May Day as a Communist holiday, and President Eisenhower proclaimed May 1 as “Loyalty Day” in 1955. Interest in Haymarket revived somewhat in the 1980s. A monument commemorating the “Haymarket martyrs” was erected in Waldheim Cemetery in 1893. In 1889 a statue honoring the dead police was erected in the Haymarket. Toppled by student radicals in 1969 and 1970, it was moved to the Chicago Police Academy. |

See How Much Money it Takes to Be Financially Secure in Your Town
What follows is a Family Budge Calculator put out by the Economic Policy Institute. www.epi.org/resources/budget/ The example shown here is for a two parent family with two children living in the capital city of New Jersey, Trenton. A typical family there needs over $75,000 in income per year to be financially secure. That means each parent would have to work full-time and be making at least $18/hour. Or, if only one parent worked, they would need to be pulling in $36/hour for their family to be financially secure. This is a long ways from minimum wage.
Family Budget Calculator
EPI’s Family Budget Calculator measures the income a family needs in order to attain a secure yet modest living standard by estimating community-specific costs of housing, food, child care, transportation, health care, other necessities, and taxes. The budgets, updated for 2013, are calculated for 615 U.S. communities and six family types (either one or two parents with one, two, or three children).
As compared with official poverty thresholds such as the federal poverty line and Supplemental Poverty Measure, EPI’s family budgets offer a higher degree of geographic customization and provide a more accurate measure of economic security. In all cases, they show families need more than twice the amount of the federal poverty line to get by. [To see and use the actual calculator for yourself readers of WordPress must go to the website at http://www.epi.org/resources/budget/ ]
Family Types include:
One Parent, One Child One Parent, Two Children One Parent, Three Children Two Parents, One Child Two Parents, Two Children Two Parents, Three Children
States Include:
AK AL AR AZ CA CO CT DC DE FL GA HI IA ID IL IN KS KY LA MA MD ME MI MN MO MS MT NC ND NE NH NJ NM NV NY OH OK OR PA RI SC SD TN TX UT VA VT WA WI WV WY
Area Names In New Jersey Include:
Atlantic City, NJ MSA Bergen-Passaic, NJ HUD Metro FMR Area Jersey City, NJ HUD Metro FMR Area Middlesex-Somerset-Hunterdon, NJ HUD Metro FMR Area Monmouth-Ocean, NJ HUD Metro FMR Area Newark, NJ HUD Metro FMR Area Ocean City, NJ MSA Philadelphia-Camden-Wilmington, PA-NJ-DE-MD MSA Trenton-Ewing, NJ MSA Vineland-Millville-Bridgeton, NJ MSA Warren County, NJ HUD Metro FMR Area
RESULTS FOR TRENTON, NJ
Trenton-Ewing, NJ MSA (NJ)
Two Parents, Two Children
|
Item |
Cost |
|
Monthly Housing |
$1206 |
|
Monthly Food |
$754 |
|
Monthly Child Care |
$1258 |
|
Monthly Transportation |
$607 |
|
Monthly Health Care |
$1519 |
|
Monthly Other Necessities |
$502 |
|
Monthly Taxes |
$447 |
|
Monthly Total |
$6292 |
|
Annual Total |
$75508 |
Family budgets are for 2013.
Learn more about EPI’s Family Budget Calculator
OVERVIEW: What Families Need to Get By: The 2013 Update of EPI’s Family Budget Calculator (EPI Issue Brief #368)
METHODOLOGY: Economic Policy Institute 2013 Family Budget Calculator: Technical Documentation (EPI Working Paper #297)
DATA: Download source data (Excel)
Wealth Inequality and Our Brewing Social Crisis
by Brian T. Lynch, MSW
Wealth disparity has a profound, relativistic impact in human societies and this is worth understanding. Even in the most egalitarian societies where everything is shared, there are subtle differences in the distribution of goods and services. These small differences convey powerful social messages that are keenly felt by all its members. These messages impact social interactions and the social order. Wealth distribution has powerful symbolic meaning in every society, large or small, rich or poor.

Wealth Disparity is Worse Than You Think – Business Insider
http://www.businessinsider.com/inequality-is-worse-than-you-think-2013-3
When the actual material differences in wealth are subtle, the costs or benefits conferred by wealth distribution are limited to social perceptions and its impact on social order or governance. These material differences are not existential threats to the socially disadvantaged. However, as the actual material differences between members of society grows, the scarcity of essential resources for some may follow. This becomes ever more consequential as it increases the efforts needed to assure survival. It introduces more uncertainty and decreases the sense of personal control. Distribution induced disparity can grow to the point where it can even become life threaten. Additionally, the social power differential grows to the point where social relationships by the advantaged towards the disadvantaged can become exploitive and extractive.
Under conditions of extreme wealth disparity there are physical and psychological impacts on both the powerful and less powerful. The Socially disadvantaged undergo significant stress and will exhibit all the symptoms and conditions associated with chronic stress (alcoholism, drug abuse, depression, maladaptive behaviors, obesity, child abuse, poor health outcomes, etc.). What is important to understand is that it is the disparity in wealth that induces social stress, not the absolute measure of wealth. Extreme wealth disparity becomes pathological in all societies, both rich or poor. This appears to have been true throughout history. Evidence of the corrosive effects of social disparity has even been demonstrated in research studying the impact of dominance on subordinate primate populations, so this appears to be a natural phenomenon.
Extreme wealth disparity is a threat to society. This fact is underappreciated by many. And distribution induced shortages don’t need to be at starvation levels before reaching critical mass, especially in wealthy countries like ours. Pundits have used this starvation metric or comparisons of our poverty to that found in poor countries to dismiss the current threat we face from rapidly growing wealth disparity. A better measure of our social instability is the health and welfare of the nation’s poor. The ranks of the poor are growing and their welfare is rapidly deteriorating. Here we find a conspiracy of silence in the main stream press. The symptoms of poverty induced stress have been reinterpreted as moral weaknesses and personal failings for which the poor have no one but themselves to blame. Both the unfair distribution of current wages and the redistribution of wealth through taxes to assist the poor are almost taboo subjects. To raise these issues is to be accused of inciting class warfare, which is exactly what has been raging for decades to bring us to this point.
The last time America experienced such enormous wealth disparity we were fortunate that the worst consequence was the Great Depression and not a total social collapse. The Great Recession of 2008 is an early warning of what will happen if we don’t correct our current wealth imbalance. So far the alarm bells are ringing but the public address system is still on mute.
1st Qrt Report: Wages Sharply Down, Bank Profit at Record High
This is an mportant story that I want to share with readers of this blog. I encourage everyone to watch the video. Feel free to add your comments.
The Real News Network
Bank Profits Soar, Wages Suffer Sharpest Decline in 60 Years
Bill Black: The economy is recovering – unless you work for a paycheck. – June 9, 2013
JAISAL NOOR, TRNN PRODUCER: Welcome to The Real News Network. I’m Jaisal Noor in Baltimore. And welcome to the latest edition of The Black Financial and Fraud Report with Bill Black, who now joins us from Kansas City, Missouri. Bill is an associate professor of economics and law at the University of Missouri-Kansas City. He’s a white-collar criminologist and former financial regulator. And he’s the author of the book The Best Way to Rob a Bank Is to Own One.
Thank you for joining us, Bill.
BILL BLACK, ASSOC. PROF. ECONOMICS AND LAW, UMKC: Thank you.
NOOR: So, Bill, what can you tell us about this latest news from the first-quarter? Bank profits soared to record levels while wages suffered their sharpest decline since 1947.
BLACK: What it all adds up to, of course: it is a very good time and a very good country to be a plutocrat, because the rich are getting richer at a staggering rate and poor people are actually getting poorer, just like the same saying goes.
So we’ve got a series of news that it has just come in this week. One thing shows that we have the largest decline in wages. Boy, that’s a big win. And that follows–that’s for the first quarter of 2013. And that follows what was a huge quarter for income in the fourth quarter, in other words the last three months of 2012. But, of course, there’s a footnote on that. And that huge quarter at the end of last year was to beat the tax increase. So that was the massive payment of bonuses to the wealthiest Americans. So they made sure the wealthiest Americans got their money before the tax increases kicked in.
And what happened as soon as we got back to the regular economy? Well, wages haven’t simply stalled; they’ve actually gotten negative. And productivity is up, which is supposed to mean that wages are up, but wages have gone in the opposite direction. So that’s the news on the wages front.
On the bank profit front, hey, we’ve got the highest reported profits ever for the first quarter of this year. Now, the twist in all of this is that the statistics, when you look at them closely, show the banks weren’t all that profitable in their regular operations, because, of course, they’re not making all that much in the way of loans and such. They’re mostly sitting on their money.
So how did the banks report record profits, but when they were doing their day-to-day business they weren’t earning all that much in the way of super profits? And the answer to all of that is that they reversed out a whole bunch of reserves for future losses, which is the same game they played leading up to the crisis. So reserves for those massive future losses, they’ve made them lower and lower. At the end of 2006, they had gotten to the lowest level of reserves against future losses in history since the savings and loan debacle. And we all know how disastrously this ended. Well, guess what? We’re at the record low again in 2007.
And this is how the accounting works. Every dollar they take out of reserves for future losses is an additional dollar they can pay in bonuses to the top executives. So the wealthier are getting wealthier at a record rate in banking as well.
So what else is happening? Well, we have record stock market appreciation. In fact, there’s a neat headline that says that when you disregard inflation–which of course you can’t–the losses that people suffered in the Great Recession have now been made back. It took a lot of years to do it, but they’ve made it back. But, of course, there’s a footnote, and the footnote says this: well, regular people haven’t, but people who own stock have made out like bandits. They’ve had a recovery measured by $1.5 trillion, and 80 percent of that gain goes to the 20 percent of richest Americans. So, hey, stock market–great news for the wealthy.
Well, but there was also some potential good news. So housing prices have finally started to go upwards. And that’s good news for all kinds of Americans who own their homes. But, again, there’s a little hitch in all of this, ’cause it turns out that for the first time in American history, a huge portion of these gains are going to massive corporations and investment firms and hedge fund types, and they are because they’re making massive purchases of homes at distressed prices to serve as what we call in the trade vulture funds and to sell it back to regular folks when those housing prices have appreciated. So a lot of this gain in housing prices is not going to regular people; it’s going to go to the hedge fund executives, who are already the wealthiest people in the world.
And how does all of this sum it up? Well, I did a paper recently on the Nobel Prize awarded to Mr. Myerson. Dr. Myerson got this award in 2007 when the world was blowing up, and he got the award for proving that fraud couldn’t exist in the financial sector. And he proved this by assuming that fraud couldn’t exist. And his mechanism for assuming that fraud doesn’t exist is plutocracy. And indeed he says the great advantage of the market system compared to socialism is that we have billionaires, and he says that people who are not that rich, in other words, ordinary multimillionaires who are CEOs, if they act rationally–that’s his word–will loot their corporations. And so the only safe thing we can do is to make some segment of Americans billionaires–in fact, probably multibillionaires–so they can run our largest corporations and made–be made into mega-billionaires. So you get a Nobel Prize for creating a system that leads to recurrent intensifying financial crises that caused $10 billion in losses in the United States and the loss of $10 million jobs. And we are told that we’re supposed to be happy and bless the system because it creates plutocrats who have incomes in the multibillion dollars who, when there is a crisis–in the words of Myerson in another article, people who are poor should pay taxes to bail out billionaire bankers, because that will be good for the poor people. That’s the status of economics in the modern era.
NOOR: So, Bill, it would seem like the dominoes are in a row for another massive financial meltdown. Would you disagree?
BLACK: No, that’s exactly what they’re putting in place. And they’re going to make the folks wealthy on both ends, right? We’re told that they have to be made billionaires so that they can invest prudently during the expansion phase of the bubble. And as soon as they destroy the economy, we’re told that we have to bail them out and make them ever wealthier. And the way we do all of these things increases the rewards to fraud and reduces the penalty to fraud, and especially in the modern era where you can dilute with impunity under the administration’s too-big-to-prosecute-or-even-indict standard.
NOOR: And finally, Bill, where are the movements that are challenging these policies?
BLACK: Well, they’re certainly not in either of the major parties. There are, of course, progressives within the Democratic Party, and they do some things, but in truth, both parties’ leadership are heavily dependent on funding from the largest banks and from other plutocrats. You’ve just seen the the Obama administration put a Pritzker in a cabinet position where the Pritzkers have a terrible reputation. And you saw that the Republicans, who usually block anyone that Obama nominates, were more than happy to have one of those wealthy folks, who is one of their kind, in a cabinet position.
So the dissent remains on places that are not typically found in the mainstream media, the Occupy movements and such. And, you know, it’s going to be the next crisis before there’s any serious chance of serious reform.
NOOR: Thank you for joining us, Bill.
BLACK: Thank you.
NOOR: And thank you for joining us on The Real News Network.
Bio – William K. Black, author of THE BEST WAY TO ROB A BANK IS TO OWN ONE, teaches economics and law at the University of Missouri Kansas City (UMKC). He was the Executive Director of the Institute for Fraud Prevention from 2005-2007. He has taught previously at the LBJ School of Public Affairs at the University of Texas at Austin and at Santa Clara University, where he was also the distinguished scholar in residence for insurance law and a visiting scholar at the Markkula Center for Applied Ethics. Black was litigation director of the Federal Home Loan Bank Board, deputy director of the FSLIC, SVP and general counsel of the Federal Home Loan Bank of San Francisco, and senior deputy chief counsel, Office of Thrift Supervision. He was deputy director of the National Commission on Financial Institution Reform, Recovery and Enforcement. Black developed the concept of “control fraud” frauds in which the CEO or head of state uses the entity as a “weapon.” Control frauds cause greater financial losses than all other forms of property crime combined. He recently helped the World Bank develop anti-corruption initiatives and served as an expert for OFHEO in its enforcement action against Fannie Mae’s former senior management.
Breadwinner Moms – A New Pew Research Report
The following report is an important story of America’s demographic shifts with significant impliciations for children. If 40% of households with children are headed by working mothers, and some smaller percentage are headed by working fathers, then we are approaching the point where only about half of the children growing up are coming from two parent families. What is the impact on tomorrows society when nearly have the young adults have not grown up with a father or mother role model in their life? It also has other significant implications in terms of equal pay for women issues, day care needs, after school programming and much more. Combine this data with the recent mile stone that there are more poor people living in the suburbs than the city and it all represents some significant social challenges that we must face.
Breadwinner Moms
Mothers Are the Sole or Primary Provider in Four-in-Ten Households with Children; Public Conflicted about the Growing Trend
by Wendy Wang, Kim Parker and Paul Taylor
http://www.pewsocialtrends.org/2013/05/29/breadwinner-moms/
CHAPTER 1: OVERVIEW

A record 40% of all households with children under the age of 18 include mothers who are either the sole or primary source of income for the family, according to a new Pew Research Center analysis of data from the U.S. Census Bureau. The share was just 11% in 1960.
These “breadwinner moms” are made up of two very different groups: 5.1 million (37%) are married mothers who have a higher income than their husbands, and 8.6 million (63%) are single mothers.1
The income gap between the two groups is quite large. The median total family income of married mothers who earn more than their husbands was nearly $80,000 in 2011, well above the national median of $57,100 for all families with children, and nearly four times the $23,000 median for families led by a single mother.2
Continue reading at the following URL: http://www.pewsocialtrends.org/2013/05/29/breadwinner-moms/
America’s Social Contract And The Measure of Our Commitment
(Note: contains some material from prior posts)
by Brian T. Lynch, MSW
A key element in America’s social contract is the idea that government derives its authority from the consent of the people. So the question should occasional be asked, is our mutual consent to be governed wearing thin? There is evidence to suggest a growing restiveness in certain populations. Some symptoms of declining consent include gridlock in congress marked by an inability to pass any legislation on a simple majority vote, the resurgence in states’ rights activism, calls in some states for secession, citizens arming themselves in fear (or perhaps the hope) of armed resistance and wide spread efforts to manipulate elections. Perhaps the best, most quantitative way to judge the degree to which we consent (or commitment) to self-government is by our willingness to pay taxes.
The attitudes we have towards paying taxes, and the extent to which people and organizations will go to avoid them, is an underappreciated index of our consent to be governed. Just as taxation without representation was a rallying cry leading up to the Revolutionary War, the Tea Party and many other popular reform or resistance groups today rally around taxes as a central point of contention. Objectively speaking, the Tea Party’s opposition to taxes makes no sense since their complaint corresponded with the lowest federal tax rate since the Eisenhower administration. It isn’t until we understand that our attitude towards taxes is a barometer of our consent to be governed that the Tea Party’s tax objections become clear.
For the sake of discussion it is helpful to identify different segments of the population that are particularly opposed to taxes. But keep in mind that our personal attitude towards paying taxes is just as valid an indicator of where each of us falls on this measure of consent.
Let’s begin with those who see themselves through the lens of American individualism. They value self-reliance and see this as a patriotic duty. They tend to think less of those who are more collaborative, more dependent or less successful. They tend to discount the contribution of the public commons to their own welfare and don’t often recognize how massively interdependent advanced societies really are. They believe that less government is best for everyone. These folks are less willing to contribute to tax supported government services other than for military defense. They are ideological individualist. This group may include some libertarians and on the extreme fringes may also include some anarchists or survivalists.
There are those who are suspicious or uncomfortable with American pluralism. These folks tend to live in parts of the country where there is little diversity or just a single predominate minority group. However, folks who hold this belief can be found everywhere. They believe a disproportionate amount of their taxes go to support other ethnic or cultural groups whose members don’t share their same values or work ethic. They may fear that these other groups are taking advantage of government largess. As a result, they are more resentful of paying taxes and more critical of what they see as wasteful government spending. These folks are pluralism-adverse and at the extreme fringes this group may include racists or hate groups. A highly nationalistic subset of this pluralism-adverse group believe their government has already broken faith with them and is threatening their liberty. For them, paying taxes is akin to paying tribute to a foreign potentate. The most extreme of these consider themselves to be soverign citizens.
There are some religious fundamentalists who believe all secular government is evil. Some fundamentalist sects focus on The Book of Revelations and an apocalyptic view of the world in which governments plays a role in the rise of the false prophet. For these groups anything that expands government is evil as well, including increased taxes. They are usually considered to be on the fringe of the Christian community, but they have an impact beyond their numbers.
Then there are those who believe taxes compete or interfere with commerce and free markets. They believe that taxes reduce the capital available for businesses investments. They fear that more taxes will lead to more government regulations and further hinder commerce. They don’t see government spending as simulative for the economy. For them, the provision of government services to those who aren’t successful contributors is an unfair redistribution of wealth. Members of this group are more likely to have higher incomes and a sense of entitlement. They may pride themselves in their ability to avoid paying taxes. At the extreme fringes of this group members tend to see society as being made up of the have and the have nots, the makers and the takers. They are often contemptuous of taxes and government.
Next, there are the disaffected and those too self-absorbed to care much about government. For this group all taxes are an annoyance to be avoided. This is a large and diverse group that is often underrepresented in our national conversations. They include many who are poor, but also many who are middle class folks working hard just to make ends meet. They tend to be swing voters when they vote and their grasp of politics and government policies are more maliable. The underground cash economy is significant for them.
The impact of this growing reluctance by some citizens to pay income taxes is huge. According to a GAO report called “HIGH-RISK SERIES, An Update”, the Internal Revenue Service estimated that the gross tax gap–the difference between taxes owed and taxes paid on time–was $450 billion for tax year 2006. The IRS estimated that it would collect $65 billion from these taxpayers through enforcement actions and late payments, leaving a net tax gap of $385 billion. This doesn’t include the loss of tax revenue due to the underground cash economy and foreign US cash transactions. These create an additional tax gap estimated to be between $400 billion and $540 billion annually. There is also the tax gap created when wealthy investors hide their money in off shore tax havens. According to a study by the Tax Justice Network the world’s super rich have at least $21 trillion secretly hidden away in tax shelters as of 2010. This is equivalent to the size of the Japanese and United States economies combined, according to The Price of Offshore Revisited report. Further, the amount of secretly hidden wealth may be as high as $32 trillion.
Arguably the most tax resistant groups, which also have the greatest fiscal and political impact, are businesses and corporations. The largest loss of tax revenue, representing the lowest level of consent to be governed, comes from the corporate sector. The shift in the percentage of total federal income taxes paid by individuals verses businesses has grown substantially over the years. Individual income taxes raised 41% of the total tax revenue in 1943 while business income taxes made up the rest, or more than half of the income tax receipts. Compare this with today where 79% of total revenues comes from individual income taxes. This shift in tax receipts from corporations to individuals cannot be explained by a shift away from C corporations (who pay the corporate income tax) to S corporations (who don’t). According to the financial site NerdWallet, the 10 most profitable U.S. companies paid an average federal tax rate of just 9 percent in 2011. The group includes such giants as Exxon Mobil, Apple, Microsoft, JPMorgan Chase and General Electric. The Economist recently posted a graphic by the Bureau of Economic Analysis that depicts the decline in corporate taxes juxtaposed to the rise in corporate profits.

The inability of the federal government to collect taxes from the nation’s elite and its biggest corporations is a serious sign of trouble. It signals a real strain in our social contract and severly limits the ability of the government to serve its people. The problem is compounded by the fact that anti-tax sentiments are being exploited by wealthy business interests to ferment dissatisfaction and distrust of our government. A coalition of the most anti-tax, anti government constituents from the various tax adverse segments of society described above would look very similar to the Tea Party base of today’s Republican Party. The power we invest in civil government is the only check we have to balance the power of the largest corporations to do as they wish in pursuit of profits. It would be a mistake to weaken our commitment to good government now when it is under assault.
There are still many who believe taxes are the price we must pay for a just and robust society. Paying taxes is our civic duty and evidence of our commitment to one another. It reflects confidence that our government is representing us and upholding the social contract. The present IRS scandal over the targeting of Tea Party groups for selective scrutiny of their 503(c)4 tax status is really a minor but convenient distraction from the real tax crisis we face. We are facing a crisis of confidence in self-government. It is a challenge of our time to rekindle a popular passion for civil government that is truly of, by and for the people.
Corporate Taxes Fall as Profits Soar
The Economist states it just right. Big corporations are avoiding their tax obligation. They have no sense of duty or obligation towards the peoples government which created corporations and the condition in which they have flourished. Increasingly, government is a gadfly to corporate profit making as citizens insist, through their government, that we breath clean air, drink pure water and eat healthy foods. Corporations are so large and powerful today that the only checks on their power is big government… hence the sustained attacks they are waging on big government. But when governments no longer have the power or ability to collect taxes from the elite or the largest corporations, they are close to colapsing. That is the message I take away from this latest report. I encourage everyone to go there and read more.
Taxing for some
America’s corporation-tax receipts falter even as company profits soar
THE pressure on tax-avoiders is mounting. In the latest episode Tim Cook, Apple’s boss, was called before a Senate subcommittee to explain why the tech giant had paid no tax on $74 billion of its profits over the past four years—though it has done nothing illegal. This comes at a time when America’s corporate profits are at a record high, thanks to the swift sacking of workers at the start of the recession, lower interest expenses, and the fact that cheap labour in emerging markets has eroded union power, allowing firms to move production offshore and defy demands for pay rises. Meanwhile corporation tax, which makes up 10% of the taxman’s total haul (down from about a third in the 1950s) has plummeted. An increase in businesses structuring themselves as partnerships and “S” corporations, which subject profits to individual rather than corporate income tax, is in part to blame. But tax havens are also culprits, as they lower their tax levels to lure in bigger firms.
