Home » Posts tagged 'Wages' (Page 2)
Tag Archives: Wages
Time for Workers to Re-Organize!
ORGANIZED LABOR?
Regardless of what you have been lead to believe about the evils of unions, there is no question that organized labor is responsible for creatiing the middle class and the good life as we know it today. But all that is in decline as anti-union sentiment grew in response to organized business interests in the 1070’s. I say this because I don’t see anyone else point out these facts. Here is another graphic view of how middle class income has declined in lock step with union membership over the years. Also, you will see that the savings in employee wages have gone directlty to the top 1% creating the huge income and wealth disparity we have today. Check it out:

It is clear to me, at least, that the heart of our economic woes is due to 40 years of wage suppression. This results in a declining middle class, a growing number of people falling into poverty, a decline in federal income tax revenue and an added burden on government to support a growing number of poor, working poor and unemployed Americans. You can’t separate chronically lower wages from our declining consumer spending. Regardless of what the economists say, if people don’t have money to spend the economy slows down and jobs disappear. Stocks are doing so well because so much of our financial sector is based on even more depressed foreign labor, yes, but also on depressed wages here at home.
If corporations what to stimulate consumer spending here, and make America attractive to foreign investors, they need to raise wages. They won’t do that because they personally benefit, financially, by keeping labor costs down. Their corporations benefit from the artificially cheap US labor pool created by government aid to the working poor for housing assistance, WIC, food stamps, daycare, etc. And then these bastards making all the money have the nerve to pit us against each other by promoting the lie that the working poor are somehow less worthy, or that they are stealing from us. If corporate leaders don’t see the light then the only alternative is for the work force to re-organize itself and demand higher wages.
Four Graphs on What Hurts the Working Class
We never hear any reference to the working class these days. The media and our politicians only speak of the “middle class” as if that covers everyone who isn’t either poor or wealth. Even references to the poor are scarce. The working class exists. They are sandwiched between the poor and the middle class and they are being squeezed into poverty. It is cruel to ignore them and the terrible pain they are suffering. What has happened to them, aside from being ignored can only be touched on by the four graphs that follow. These were presented in a conversation I had with conservative friend of mine who has forgotten the working class exists. There are many factors hurting the working class. This conversation was only about four factors, wage suppression, the upward redistribution of wealth, working class decent into poverty and declining upward mobility. Post this is my way of addressing what I believe is the most hurtful factor of them all… public silence.
Q: I always thought of the owners as the producers of the jobs that the workers have. You say that it is the workers who are the producers. Have you ever been employed by someone on welfare?
A: Owners coordinate the workforce, but it the employees who do the work that makes the products or services. So in a real sense, the workers ARE the producers. And this has nothing to do with welfare at all. Jobs are not a product. Stuff is a product. Things to sell or trade is a product. Workers are key to making stuff or offering stuff yet when they want a fair share of the value they create they are treated like thieves. Read this and you will know what I am talking about even if you don’t agree:
http://aseyeseesit.blogspot.com/…/fair-wage-for-days…

I also just ran across this table (below) that shows were all the Hourly GDP wealth has gone since the mid-’70’s.
Source: https://scontent-a-lga.xx.fbcdn.net/hphotos-prn2/1480602_10200873563747333_1576469932_n.jpg
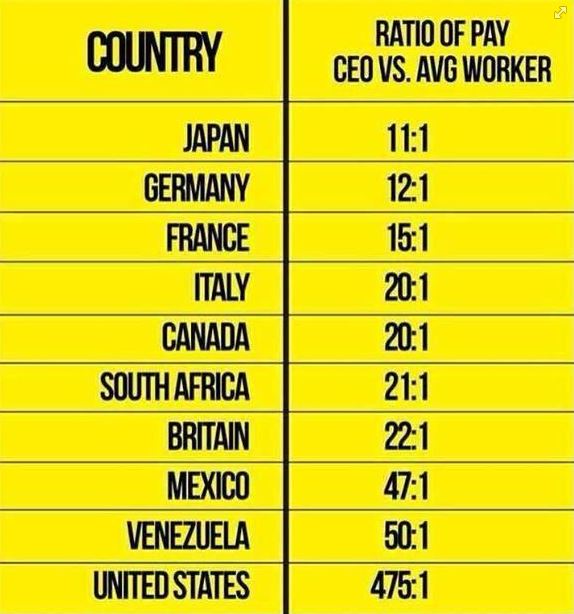
Q: Why should it matter how much a C.E.O. makes if their workers remain on the job? It’s one of the great things about this country. You can work where ever and for whom ever you want. Someone please explain to me why it is greed for C.E.O.’s to make deals to be paid as much as the market will bear but it is ok for workers to make deals to make as much as the market will bear.
A: It may not matter to you at all, but anyone who wonder why they can’t have collective barganing while the CEO is making 400 times their salary might have questions, especially since this is strictly a feature of the US economy and others around the world are paid better than we are relative to their economies.
Don’t forget, almost 40% of people who work full time are poor. I’m not sure what percentage of the poor they account for, but it is clear when we speak of the poor we are not speaking only of people who are disabled, elderly, retired or unemployed.

http://upload.wikimedia.org/wi…/en/7/74/Pov_crossnatl.jpeg
Note here that in the US, the number of working poor (blue bar in right hand column) is twice the number of non-working poor. So when you and I talk about the poor, you are defining it as welfare recipients while I broadly define it as everyone living below the poverty line, the majority of whom work full time. That’s partly why we have a disconnect on this topic. In my understanding, most poor people work.
Q: I wonder how many of the poor who are now C.E.O.’s would agree with you? Or would they say : “Work hard towards your goal, as I did, and you can achieve anything.”. Isn’t this what made our economy great? Not people who wanted a wage so they could be comfortable in the position they have today? Flipping burgers at McDonalds is not supposed to be a permanent career goal. Even the management at McDonalds wants people to move up. Or am I wrong about incentive and ambition?
A: There are 17,000 companies with 500 employees or more. There are 43 million poor. If 20% of CEO’s started out as poor children that would mean there are only about 4,200 CEO openings for 43 million potential applicants. It’s a safe bet that far fewer than 20% of CEO’s come from poverty. In fact, less than 20% of children born to poorest families will make it into the middle class in their lifetime. Less than 8% will make over $140k/year, which is approximately the income line where the richest fifth starts. Of those at the top, only the smallest fraction will become a CEO. I believe that if you really understood the economic situation in America you, of all the folks I know, would be a big supporter of the working class.

source: http://www.pewtrusts.org/…/Eco…/PEW_Upward%20EM%2014.pdf
As for incentive and ambition, a good paying job that makes one economically self-sufficient is the highest motivator. But a self-sufficient wage for a single earners is over $30,000/year whereas the median wage for a single earners is less than $26,000/year. In other words, the incentives are less than optimal in today’s economy, and no amount of hard work or individual effort will make a difference for most people until even low wage workers receive a fair wage for a days work.
The Economy Didn’t Stall for Congress During Recession
by Brian T. Lynch, MSW
|
The Wealthiest US Legislators Estimated Net Worth
|
|
|
Issa, Darrell (R-Calf) House
|
$448,125,017
|
|
McCaul, Michael (R-Tex) House
|
$380,411,527
|
|
Harman, Jane (D-Calf) House
|
$326,844,751
|
|
Kerry, John (D-Mass) Senate
|
$231,722,794
|
|
Kohl, Herb (D-Wis) Senate
|
$173,538,010
|
|
Combined Wealth
|
$1,560,642,099
|


|
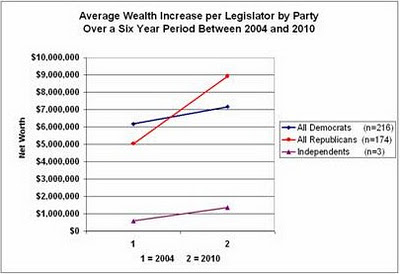
Average Wealth Increase per Legislator by Party and Chamber – 2004 and 2010
|
|||||
|
Wealth /Member in 2004
|
Wealth /Member in 2010
|
Six Year Dif /Member
|
Total % Change
|
Annual % Change
|
|
|
House Democrats (n=176)
|
$2,918,824
|
$4,408,237
|
$1,489,414
|
51.0%
|
8.50%
|
|
House Republicans (n=133)
|
$5,243,557
|
$10,111,971
|
$4,868,414
|
92.8%
|
15.47%
|
|
Senate Democrats (n=40)
|
$20,516,818
|
$19,323,256
|
-$1,193,561
|
-5.8%
|
-0.97%
|
|
Senate Republicans (n=41)
|
$4,394,130
|
$5,128,482
|
$734,352
|
16.7%
|
2.79%
|
|
Senate Independents (n=3)
|
$577,182
|
$1,359,855
|
$782,673
|
135.6%
|
22.6%
|


|
Total Wealth Increase of All US Legislators Between 2004 and 2010
|
|||||
|
Average Wealth in 2004
|
Average Wealth in 2010
|
Difference in Six Years
|
Total % Change
|
Annual % Change
|
|
|
All Members (n=393)
|
$2,213,699,631
|
$3,108,019,528
|
$894,319,897
|
40.4%
|
6.7%
|
|
All Democrats (n=216)
|
$1,334,385,659
|
$1,548,780,022
|
$214,394,363
|
16.1%
|
2.7%
|
|
All Republicans (n=174)
|
$877,552,427
|
$1,555,159,941
|
$677,607,514
|
77.2%
|
12.9%
|
|
Independents (n=3)
|
$1,731,545
|
$4,079,565
|
$2,348,020
|
135.6%
|
22.6%
|
|
Senators (n=84)
|
$1,002,563,604
|
$987,277,595
|
-$15,286,009
|
-1.5%
|
-0.3%
|
|
Congressmen (n=309)
|
$1,211,147,532
|
$2,120,971,945
|
$909,824,413
|
75.1%
|
12.5%
|
|
Average Wealth Increase Per US Legislator by Party and Chamber Between 2004 and 2010
|
|||||
|
Wealth /Member in 2004
|
Wealth /Member in 2010
|
Six Year Dif /Member
|
Total % Change
|
Annual % Change
|
|
|
All Members (n=393)
|
$5,632,823
|
$7,908,447
|
$2,275,623
|
40.4%
|
6.7%
|
|
All Democrats (n=216)
|
$6,177,711
|
$7,170,278
|
$992,566
|
16.1%
|
2.7%
|
|
All Republicans (n=174)
|
$5,043,405
|
$8,937,701
|
$3,894,296
|
77.2%
|
12.9%
|
|
Independents (n=3)
|
$577,182
|
$1,359,855
|
$782,673
|
135.6%
|
22.6%
|
|
Senators (n=84)
|
$11,935,281
|
$11,753,305
|
-$181,976
|
-1.5%
|
-0.3%
|
|
Congressmen (n-309)
|
$3,919,571
|
$6,863,987
|
$2,944,416
|
75.1%
|
12.5%
|
|
Average Wealth Increase of All US Legislators by Party Between 2004 and 2010
|
|||||
|
Average Wealth in 2004
|
Average Wealth in 2010
|
Difference in Six Years
|
Total % Change
|
Annual % Change
|
|
|
House Democrats (n=176)
|
$513,712,948
|
$775,849,769
|
$262,136,821
|
51.0%
|
8.50%
|
|
House Republicans (n=133)
|
$697,393,079
|
$1,344,892,164
|
$647,499,085
|
92.8%
|
15.47%
|
|
Senate Democrats (n=40)
|
$820,672,711
|
$772,930,253
|
-$47,742,458
|
-5.8%
|
-0.97%
|
|
Senate Republicans (n=41)
|
$180,159,348
|
$210,267,777
|
$30,108,429
|
16.7%
|
2.79%
|
|
Senate Independents (n=3)
|
$1,731,545
|
$4,079,565
|
$2,348,020
|
135.6%
|
22.6%
|
|
Average Wealth Increase per Legislator by Party and Chamber – 2004 and 2010
|
|||||
|
Wealth /Member in 2004
|
Wealth /Member in 2010
|
Six Year Dif /Member
|
Total % Change
|
Annual % Change
|
|
|
House Democrats (n=176)
|
$2,918,824
|
$4,408,237
|
$1,489,414
|
51.0%
|
8.50%
|
|
House Republicans (n=133)
|
$5,243,557
|
$10,111,971
|
$4,868,414
|
92.8%
|
15.47%
|
|
Senate Democrats (n=40)
|
$20,516,818
|
$19,323,256
|
-$1,193,561
|
-5.8%
|
-0.97%
|
|
Senate Republicans (n=41)
|
$4,394,130
|
$5,128,482
|
$734,352
|
16.7%
|
2.79%
|
|
Senate Independents (n=3)
|
$577,182
|
$1,359,855
|
$782,673
|
135.6%
|
22.6%
|
|
Top Ten Legislators /w Biggest Jump in Wealth ($ increase) by Party and Chamber – 2004 and 2010
|
|||||
|
Aggregated Totals
|
Average Wealth in 2004
|
Average Wealth in 2010
|
Difference in Six Years
|
Total % Change
|
Annual % Change
|
|
House Democrats (n=176)
|
$327,705,235
|
$568,142,204
|
$240,436,969
|
73.4%
|
12.2%
|
|
House Republicans (n=133)
|
$331,746,289
|
$1,005,864,579
|
$674,118,290
|
203.2%
|
33.9%
|
|
Senate Democrats (n=40)
|
$137,206,389
|
$216,341,049
|
$79,134,660
|
57.7%
|
9.6%
|
|
Senate Republicans (n=41)
|
$21,576,271
|
$81,888,741
|
$60,312,470
|
279.5%
|
46.6%
|
|
Top Ten Legislators /w Biggest Jump in Wealth ($ increase) by Party and Chamber – 2004 and 2010
|
|||||
|
Average per Legislator
|
Wealth /Member in 2004
|
Wealth /Member in 2010
|
Six Year Dif /Member
|
Total % Change
|
Annual % Change
|
|
House Democrats (n=176)
|
1,861,962
|
3,228,081
|
1,366,119
|
73.4%
|
12.2%
|
|
House Republicans (n=133)
|
2,494,333
|
7,562,892
|
5,068,559
|
203.2%
|
33.9%
|
|
Senate Democrats (n=40)
|
3,430,160
|
5,408,526
|
1,978,367
|
57.7%
|
9.6%
|
|
Senate Republicans (n=41)
|
526,251
|
1,997,286
|
1,471,036
|
279.5%
|
46.6%
|
|
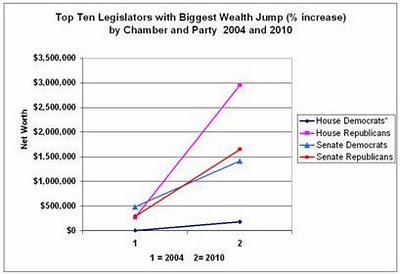
Top TenLegislators /w Biggest Jump in Wealth (% increase) by Chamber & Party – 2004 and 2010
|
|||||
|
Aggregated Totals
|
Average Wealth in 2004
|
Average Wealth in 2010
|
Difference in Six Years
|
Total % Change
|
Annual % Change
|
|
House Democrats*
|
$779,531
|
$31,996,557
|
$31,217,026
|
4004.6%
|
667.4%
|
|
House Republicans
|
$35,430,212
|
$392,877,862
|
$357,447,650
|
1008.9%
|
168.1%
|
|
Senate Democrats
|
$19,415,702
|
$56,516,827
|
$37,101,125
|
191.1%
|
31.8%
|
|
Senate Republicans
|
$11,871,405
|
$67,686,976
|
$55,815,571
|
470.2%
|
78.4%
|
|
Top TenLegislators /w Biggest Jump in Wealth (% increase) by Chamber & Party – 2004 and 2010
|
|||||
|
Average per Legislator
|
Wealth /Member in 2004
|
Wealth /Member in 2010
|
Six Year Dif /Member
|
Total % Change
|
Annual % Change
|
|
House Democrats*
|
$4,429
|
$181,799
|
$177,369
|
4004.6%
|
667.4%
|
|
House Republicans
|
$266,393
|
$2,953,969
|
$2,687,576
|
470.2%
|
78.4%
|
|
Senate Democrats
|
$485,393
|
$1,412,921
|
$927,528
|
191.1%
|
31.8%
|
|
Senate Republicans
|
$289,546
|
$1,650,902
|
$1,361,355
|
470.2%
|
78.4%
|
|
* One member, P. Kennedy, accounted for most of the increase. Excluding him for the in rank on the list yeilds an increase of 1,602.6% or 267.1% annual increase.
|
|||||
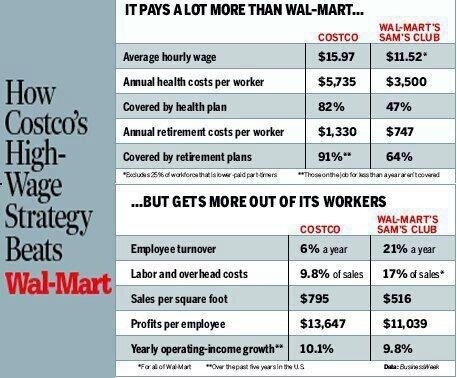
Higher Wages – Good for Families, Good for Economy & Good for Business
Below is another graphic that speaks for itself. Not only does paying higher wages improve the US economy and the lives of every citizen, it also makes good business sense.
I have written extensively on wage history and the case for a living wage, wealth distribution in America, our global business competitiveness, the dangers of our growing wealth inequality, and many other issues effecting middle and working class Americans, including and post on class warfare.
In a Labor Day message from former Secretary of Labor, Robert Reich, he, ” breaks down what it’ll take for workers to get a fair share in this economy — including big, profitable corporations like McDonald’s and Walmart to pony up and finally pay fair wages.
There is a petition that you can sign if you click on the above link. Please consider it your Labor Day obligation to those who struggled and even died to give you the benefits we still have today.
Labor Day – A Day for Reflection
Labor Day. For much of the world this is a day of reflection to honor the martyrs who stood up to wealthy capitalists in the fight for dignified employment, the eight-hour workday and the five-day work week. It is a day to honor those who sacrificed their lives so that we might be home in time to eat dinner with our families and to have Saturday’s off to watch our children play baseball or soccer. It is a reminder that many of the blessings we take for granted today came at a terrible price. If we forget how we got these benefits they will slowly erode over time and history will reap itself.
Much of the world celebrates Labor Day not in August, but in May. Have you ever wondered why? Would you be surprised to learn that labor celebrations around the world commemorate events that took place in Chicago in 1816? Students of history will recognize this as the Haymarket, or May Day Massacre. Below is one account from the Encyclopedia of Chicago History via Wikipedia. http://www.encyclopedia.chicagohistory.org/pages/571.html
Haymarket and May DayLABOR UNREST, 1886 (MAP)
On May 1, 1886, Chicago unionists, reformers, socialists,anarchists, and ordinary workers combined to make the city the center of the national movement for an eight-hour day. Between April 25 and May 4, workers attended scores of meetings and paraded through the streets at least 19 times. On Saturday, May 1, 35,000 workers walked off their jobs. Tens of thousands more, both skilled and unskilled, joined them on May 3 and 4. Crowds traveled from workplace to workplace urging fellow workers to strike. Many now adopted the radical demand of eight hours’ work for ten hours’ pay. Police clashed with strikers at least a dozen times, three with shootings. At the McCormick reaper plant, a long-simmering strike erupted in violence on May 3, and police fired at strikers, killing at least two. Anarchists called a protest meeting at the West Randolph Street Haymarket, advertising it in inflammatory leaflets, one of which called for “Revenge!” The crowd gathered on the evening of May 4 on Des Plaines Street, just north of Randolph, was peaceful, and Mayor Carter H. Harrison, who attended, instructedpolice not to disturb the meeting. But when one speaker urged the dwindling crowd to “throttle” the law, 176 officers under Inspector John Bonfield marched to the meeting and ordered it to disperse. Then someone hurled a bomb at the police, killing one officer instantly. Police drew guns, firing wildly. Sixty officers were injured, and eight died; an undetermined number of the crowd were killed or wounded. The Haymarket bomb seemed to confirm the worst fears of business leaders and others anxious about the growing labor movement and radical influence in it. Mayor Harrison quickly banned meetings and processions. Police made picketing impossible and suppressed the radical press. Chicago newspapers publicized unsubstantiated police theories of anarchist conspiracies, and they published attacks on the foreign-born and calls for revenge, matching the anarchists in inflammatory language. The violence demoralized strikers, and only a few well-organized strikes continued. Police arrested hundreds of people, but never determined the identity of the bomb thrower. Amidst public clamor for revenge, however, eight anarchists, including prominent speakers and writers, were tried for murder. The partisan Judge Joseph E. Gary conducted the trial, and all 12 jurors acknowledged prejudice against the defendants. Lacking credible evidence that the defendants threw the bomb or organized the bomb throwing, prosecutors focused on their writings and speeches. The jury, instructed to adopt a conspiracy theory without legal precedent, convicted all eight. Seven were sentenced to death. The trial is now considered one of the worst miscarriages of justice in American history. Many Americans were outraged at the verdicts, but legal appeals failed. Two death sentences were commuted, but on November 11, 1887, four defendants were hanged in the Cook County jail; one committed suicide. Hundreds of thousands turned out for the funeral procession of the five dead men. In 1893, Governor John Peter Altgeld granted the three imprisoned defendants absolute pardon, citing the lack of evidence against them and the unfairness of the trial. Inspired by the American movement for a shorter workday, socialists and unionists around the world began celebrating May 1, or “May Day,” as an international workers’ holiday. In the twentieth century, the Soviet Union and other Communist countries officially adopted it. The Haymarket tragedy is remembered throughout the world in speeches, murals, and monuments. American observance was strongest in the decade before World War I. During the Cold War, many Americans saw May Day as a Communist holiday, and President Eisenhower proclaimed May 1 as “Loyalty Day” in 1955. Interest in Haymarket revived somewhat in the 1980s. A monument commemorating the “Haymarket martyrs” was erected in Waldheim Cemetery in 1893. In 1889 a statue honoring the dead police was erected in the Haymarket. Toppled by student radicals in 1969 and 1970, it was moved to the Chicago Police Academy. |

See How Much Money it Takes to Be Financially Secure in Your Town
What follows is a Family Budge Calculator put out by the Economic Policy Institute. www.epi.org/resources/budget/ The example shown here is for a two parent family with two children living in the capital city of New Jersey, Trenton. A typical family there needs over $75,000 in income per year to be financially secure. That means each parent would have to work full-time and be making at least $18/hour. Or, if only one parent worked, they would need to be pulling in $36/hour for their family to be financially secure. This is a long ways from minimum wage.
Family Budget Calculator
EPI’s Family Budget Calculator measures the income a family needs in order to attain a secure yet modest living standard by estimating community-specific costs of housing, food, child care, transportation, health care, other necessities, and taxes. The budgets, updated for 2013, are calculated for 615 U.S. communities and six family types (either one or two parents with one, two, or three children).
As compared with official poverty thresholds such as the federal poverty line and Supplemental Poverty Measure, EPI’s family budgets offer a higher degree of geographic customization and provide a more accurate measure of economic security. In all cases, they show families need more than twice the amount of the federal poverty line to get by. [To see and use the actual calculator for yourself readers of WordPress must go to the website at http://www.epi.org/resources/budget/ ]
Family Types include:
One Parent, One Child One Parent, Two Children One Parent, Three Children Two Parents, One Child Two Parents, Two Children Two Parents, Three Children
States Include:
AK AL AR AZ CA CO CT DC DE FL GA HI IA ID IL IN KS KY LA MA MD ME MI MN MO MS MT NC ND NE NH NJ NM NV NY OH OK OR PA RI SC SD TN TX UT VA VT WA WI WV WY
Area Names In New Jersey Include:
Atlantic City, NJ MSA Bergen-Passaic, NJ HUD Metro FMR Area Jersey City, NJ HUD Metro FMR Area Middlesex-Somerset-Hunterdon, NJ HUD Metro FMR Area Monmouth-Ocean, NJ HUD Metro FMR Area Newark, NJ HUD Metro FMR Area Ocean City, NJ MSA Philadelphia-Camden-Wilmington, PA-NJ-DE-MD MSA Trenton-Ewing, NJ MSA Vineland-Millville-Bridgeton, NJ MSA Warren County, NJ HUD Metro FMR Area
RESULTS FOR TRENTON, NJ
Trenton-Ewing, NJ MSA (NJ)
Two Parents, Two Children
|
Item |
Cost |
|
Monthly Housing |
$1206 |
|
Monthly Food |
$754 |
|
Monthly Child Care |
$1258 |
|
Monthly Transportation |
$607 |
|
Monthly Health Care |
$1519 |
|
Monthly Other Necessities |
$502 |
|
Monthly Taxes |
$447 |
|
Monthly Total |
$6292 |
|
Annual Total |
$75508 |
Family budgets are for 2013.
Learn more about EPI’s Family Budget Calculator
OVERVIEW: What Families Need to Get By: The 2013 Update of EPI’s Family Budget Calculator (EPI Issue Brief #368)
METHODOLOGY: Economic Policy Institute 2013 Family Budget Calculator: Technical Documentation (EPI Working Paper #297)
DATA: Download source data (Excel)
Is Our Obesity Epidemic a Result of the War on Wages?
America has a growing obesity epidemic. This we know for certain. We also know that obesity is far more prevalent among poor Americans and that more and more Americans are slipping into poverty. Real, inflation adjusted wages have been stagnant for over 30 years. Current wages are in decline and the number of people below the poverty line is near an all time high.

What is the link between poverty and obesity? It is a fact that the five states with the greatest obesity levels are also among the ten poorest states. They are also among the states with the lowest life expectancy. One theory as to why the poor are more likely to be obese is that they don’t have access to healthy foods in poor neighborhoods.
In April of this year the New York Times published an article highlighting two recent studies that looked at whether people in poor communities had access to stores and supermarkets that sold fresh, healthy foods. These two studies found that the poor have as much, or more access to stores selling healthy foods. One study found that poor neighborhoods have twice as many fast food restaurants and corner stores, but almost twice as many supermarkets as well. So the “food desert” theory of why poor American are more obese appears to be false.
A second theory on the connection between obesity and the poor is that they can’t afford to eat healthy. This is the “calories are cheap, nutrition is expensive” theory. Supporting this notion a recent American Journal of Clinical Nutrition study that found $1 could buy 1,200 calories of potato chips but just 250 calories of vegetables and 170 calories of fresh fruit. An excellent CNN article recently reported that:
“Ground beef that is 80/20 is fattier but cheaper than 90/10. Ground turkey breast is leaner than the other two but is usually the more expensive. And many of us can’t even begin to think about free-range chicken and organic produce — food without pesticides and antibiotics that’ll cost you a second mortgage in no time at all.”
And the cost of groceries is rising. The U.S. Department of Agriculture estimated the weekly grocery bill for a family of four was about at $134.50 in 2010 and $141.20 in 2011. An extra $7.00 per week is a lot for families living below the poverty line, especial when family incomes are in decline.
Other recent research also suggests a strong link between poverty, obesity and US food policy. While genetics may play a role in obesity, socioeconomic class may be a better predictor of obesity.
AcademicEarth.org has posted a brief video on their Website explaining this link that also relates it to current U.S. food policies. They report that Americans today eat 25% more calories than they did in the 1970’s (the same time period when hourly wages stopped rising with hourly productivity). The additional calorie intake is skewed towards lower income families. This important video federal food subsidies and other U.S. policies may be directly contributing to the current obesity crisis. Please view the video here: http://academicearth.org/electives/the-economic-cost-of-obesity/.
Created by AcademicEarth.org
1st Qrt Report: Wages Sharply Down, Bank Profit at Record High
This is an mportant story that I want to share with readers of this blog. I encourage everyone to watch the video. Feel free to add your comments.
The Real News Network
Bank Profits Soar, Wages Suffer Sharpest Decline in 60 Years
Bill Black: The economy is recovering – unless you work for a paycheck. – June 9, 2013
JAISAL NOOR, TRNN PRODUCER: Welcome to The Real News Network. I’m Jaisal Noor in Baltimore. And welcome to the latest edition of The Black Financial and Fraud Report with Bill Black, who now joins us from Kansas City, Missouri. Bill is an associate professor of economics and law at the University of Missouri-Kansas City. He’s a white-collar criminologist and former financial regulator. And he’s the author of the book The Best Way to Rob a Bank Is to Own One.
Thank you for joining us, Bill.
BILL BLACK, ASSOC. PROF. ECONOMICS AND LAW, UMKC: Thank you.
NOOR: So, Bill, what can you tell us about this latest news from the first-quarter? Bank profits soared to record levels while wages suffered their sharpest decline since 1947.
BLACK: What it all adds up to, of course: it is a very good time and a very good country to be a plutocrat, because the rich are getting richer at a staggering rate and poor people are actually getting poorer, just like the same saying goes.
So we’ve got a series of news that it has just come in this week. One thing shows that we have the largest decline in wages. Boy, that’s a big win. And that follows–that’s for the first quarter of 2013. And that follows what was a huge quarter for income in the fourth quarter, in other words the last three months of 2012. But, of course, there’s a footnote on that. And that huge quarter at the end of last year was to beat the tax increase. So that was the massive payment of bonuses to the wealthiest Americans. So they made sure the wealthiest Americans got their money before the tax increases kicked in.
And what happened as soon as we got back to the regular economy? Well, wages haven’t simply stalled; they’ve actually gotten negative. And productivity is up, which is supposed to mean that wages are up, but wages have gone in the opposite direction. So that’s the news on the wages front.
On the bank profit front, hey, we’ve got the highest reported profits ever for the first quarter of this year. Now, the twist in all of this is that the statistics, when you look at them closely, show the banks weren’t all that profitable in their regular operations, because, of course, they’re not making all that much in the way of loans and such. They’re mostly sitting on their money.
So how did the banks report record profits, but when they were doing their day-to-day business they weren’t earning all that much in the way of super profits? And the answer to all of that is that they reversed out a whole bunch of reserves for future losses, which is the same game they played leading up to the crisis. So reserves for those massive future losses, they’ve made them lower and lower. At the end of 2006, they had gotten to the lowest level of reserves against future losses in history since the savings and loan debacle. And we all know how disastrously this ended. Well, guess what? We’re at the record low again in 2007.
And this is how the accounting works. Every dollar they take out of reserves for future losses is an additional dollar they can pay in bonuses to the top executives. So the wealthier are getting wealthier at a record rate in banking as well.
So what else is happening? Well, we have record stock market appreciation. In fact, there’s a neat headline that says that when you disregard inflation–which of course you can’t–the losses that people suffered in the Great Recession have now been made back. It took a lot of years to do it, but they’ve made it back. But, of course, there’s a footnote, and the footnote says this: well, regular people haven’t, but people who own stock have made out like bandits. They’ve had a recovery measured by $1.5 trillion, and 80 percent of that gain goes to the 20 percent of richest Americans. So, hey, stock market–great news for the wealthy.
Well, but there was also some potential good news. So housing prices have finally started to go upwards. And that’s good news for all kinds of Americans who own their homes. But, again, there’s a little hitch in all of this, ’cause it turns out that for the first time in American history, a huge portion of these gains are going to massive corporations and investment firms and hedge fund types, and they are because they’re making massive purchases of homes at distressed prices to serve as what we call in the trade vulture funds and to sell it back to regular folks when those housing prices have appreciated. So a lot of this gain in housing prices is not going to regular people; it’s going to go to the hedge fund executives, who are already the wealthiest people in the world.
And how does all of this sum it up? Well, I did a paper recently on the Nobel Prize awarded to Mr. Myerson. Dr. Myerson got this award in 2007 when the world was blowing up, and he got the award for proving that fraud couldn’t exist in the financial sector. And he proved this by assuming that fraud couldn’t exist. And his mechanism for assuming that fraud doesn’t exist is plutocracy. And indeed he says the great advantage of the market system compared to socialism is that we have billionaires, and he says that people who are not that rich, in other words, ordinary multimillionaires who are CEOs, if they act rationally–that’s his word–will loot their corporations. And so the only safe thing we can do is to make some segment of Americans billionaires–in fact, probably multibillionaires–so they can run our largest corporations and made–be made into mega-billionaires. So you get a Nobel Prize for creating a system that leads to recurrent intensifying financial crises that caused $10 billion in losses in the United States and the loss of $10 million jobs. And we are told that we’re supposed to be happy and bless the system because it creates plutocrats who have incomes in the multibillion dollars who, when there is a crisis–in the words of Myerson in another article, people who are poor should pay taxes to bail out billionaire bankers, because that will be good for the poor people. That’s the status of economics in the modern era.
NOOR: So, Bill, it would seem like the dominoes are in a row for another massive financial meltdown. Would you disagree?
BLACK: No, that’s exactly what they’re putting in place. And they’re going to make the folks wealthy on both ends, right? We’re told that they have to be made billionaires so that they can invest prudently during the expansion phase of the bubble. And as soon as they destroy the economy, we’re told that we have to bail them out and make them ever wealthier. And the way we do all of these things increases the rewards to fraud and reduces the penalty to fraud, and especially in the modern era where you can dilute with impunity under the administration’s too-big-to-prosecute-or-even-indict standard.
NOOR: And finally, Bill, where are the movements that are challenging these policies?
BLACK: Well, they’re certainly not in either of the major parties. There are, of course, progressives within the Democratic Party, and they do some things, but in truth, both parties’ leadership are heavily dependent on funding from the largest banks and from other plutocrats. You’ve just seen the the Obama administration put a Pritzker in a cabinet position where the Pritzkers have a terrible reputation. And you saw that the Republicans, who usually block anyone that Obama nominates, were more than happy to have one of those wealthy folks, who is one of their kind, in a cabinet position.
So the dissent remains on places that are not typically found in the mainstream media, the Occupy movements and such. And, you know, it’s going to be the next crisis before there’s any serious chance of serious reform.
NOOR: Thank you for joining us, Bill.
BLACK: Thank you.
NOOR: And thank you for joining us on The Real News Network.
Bio – William K. Black, author of THE BEST WAY TO ROB A BANK IS TO OWN ONE, teaches economics and law at the University of Missouri Kansas City (UMKC). He was the Executive Director of the Institute for Fraud Prevention from 2005-2007. He has taught previously at the LBJ School of Public Affairs at the University of Texas at Austin and at Santa Clara University, where he was also the distinguished scholar in residence for insurance law and a visiting scholar at the Markkula Center for Applied Ethics. Black was litigation director of the Federal Home Loan Bank Board, deputy director of the FSLIC, SVP and general counsel of the Federal Home Loan Bank of San Francisco, and senior deputy chief counsel, Office of Thrift Supervision. He was deputy director of the National Commission on Financial Institution Reform, Recovery and Enforcement. Black developed the concept of “control fraud” frauds in which the CEO or head of state uses the entity as a “weapon.” Control frauds cause greater financial losses than all other forms of property crime combined. He recently helped the World Bank develop anti-corruption initiatives and served as an expert for OFHEO in its enforcement action against Fannie Mae’s former senior management.
Visualizing Our Wealth Inequality
Wealth Inequality in America
CLASS WARFARE – OVERVIEW OF WAGES, TAXES and WEALTH IN AMERICA
Since Reagan in 1980’s Tax Rates for the wealth were cut in half and capital gains tax (where most make their money) was cut in half again. http://j.mp/ZFFQHB
Wages and GDP rose together until wages were suppressed in the 70’s, otherwise median income today would be greater than $100K instead of $51K http://j.mp/14MoT67
The combination of wage suppression and the collapse of the upper income tax brackets is the cause of our wealth and income inequality today. http://j.mp/102YbAk and http://j.mp/10DVrLn
A majority of American’s don’t make enough money to support a robust economy because a handful of us have more money than they can spend. http://j.mp/16E3zOT
Current US policy is creating permanent income inequality. Income mobility is shrinking as income caste system forms. http://t.co/nK5uFGyCaG
We know what victory looks like in Class Warfare. It’s the formation of an income caste system where birth determines your level of success. http://j.mp/Y1HwQP
Obama’s proposed raise in min. wage from $7.20 to $9/hr would mean a person working 40hr/week at min. wage would still be below poverty line. http://j.mp/10DwY7V
If the minimum wage was raised to $18/hour the Federal Government could eliminate almost all aid to the working poor, saving tons of money. http://j.mp/10DVrLn
Every tax dollar paid to assist the working poor is a tax subsidy providing their employer a federally funded labor discount. http://j.mp/16Bml7r
God! When are we going to wake up?
